Unlock the Full Potential of Graph VisualizationDiscover how graph technology transforms industries, applications, and workflows.
yFiles enables innovative solutions for a wide range of industries and use cases. Whether optimizing processes, analyzing complex networks, or visualizing data relationships, our technology helps businesses unlock deeper insights. Explore real-world applications and success stories to see how graph visualization can work for you.
Take off and create your first graph application
The yFiles diagramming library supports every step, whether you are exploring its capabilities for the first time or developing a complete prototype. Hundreds of source code demos make it easy to get started or get deeper into specific use cases. Expert guidance from core developers ensures that challenges can be overcome efficiently.
Start visualizing complex networks and dynamic relationships today with yFiles!
Test yFiles free of charge

We´d love to help you. Reach out and we'll get in touch with you.
Your message has been sent.
Graph Technology Across Industries

Industries Overview
Automotive
Optimize supply chains and prevent defects.Financial Services
Detect fraud and enhance compliance.Life Sciences
Advance research with connected data insights.Networking and telecommunication
Ensure performance and secure systems.Software Engineering
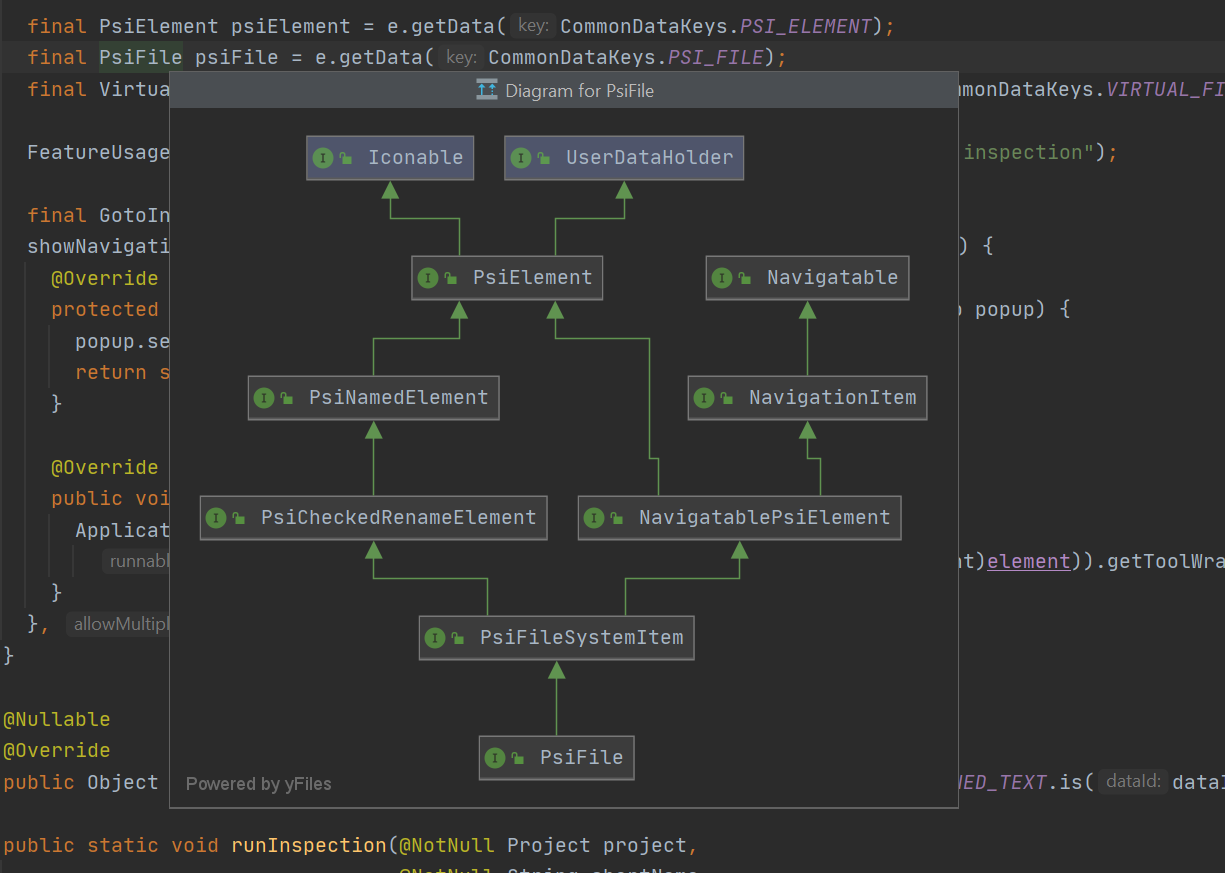
Visualize architectures and dependencies.


Network visualization use casesExplore real-world scenarios where graph visualization makes a difference.
Discover how organizations leverage graph visualization to solve challenges, optimize processes, and uncover insights. From process flows (BPMN), knowledge graph visualization for LLMs , and Gantt charts to fraud detection and company ownership mapping, diagramming use cases highlight the versatility and impact of graph-based solutions.
Each use case showcases specific techniques and applications, offering inspiration and practical guidance for your own projects.
Explore use cases
Case Studies: Real-world Success StoriesLearn how organizations solved complex challenges with yFiles.
Get to know innovative solutions and find out how yFiles can be used to achieve powerful results in your own projects.


