Gantt Chart VisualizationCreate and customize Gantt charts with code

A Gantt chart is an indispensable tool for project management, providing a clear visual representation of tasks and timelines. This powerful tool allows you to:
- Organize Tasks and Milestones Create a structured timeline for all project components.
- Plan and Schedule Efficiently Allocate resources and set deadlines to streamline project execution.
- Track Progress Monitor real-time updates and adjustments.
- Enhance Collaboration Facilitate communication across teams.
- Simplify Complex Projects Break down intricate projects into manageable segments.

Start developing Gantt charts with yFiles
If you're looking to program Gantt charts, yFiles provides the advanced tools you need to get started quickly. With yFiles, you can:
- Build Custom Gantt Charts: Develop highly customizable charts tailored to your project’s unique needs.
- Code Efficiently: Use yFiles’ intuitive API to streamline your development process.
- Integrate Seamlessly: Incorporate Gantt charts into your existing applications with ease.
- Scale with Confidence: Handle projects of any size, from small tasks to complex schedules.
Start programming your Gantt chart with yFiles today!
Start your Gantt chart development

We´d love to help you. Reach out and we'll get in touch with you.
Your message has been sent.

What is a Gantt Chart? A Simple Breakdown
A Gantt chart visually organizes tasks along a timeline, showing their start and end dates.
1. The basic structure includes
- Task List Displayed on the left side.
- Timeline Represented horizontally on the right.
- Task Bars Horizontal bars indicating the duration and overlap of tasks.
2. Challenges with Traditional Gantt Chart Tools
- Limited Customization Often rigid and unable to meet unique project requirements.
- Manual Updates Time-consuming and prone to errors.
- Poor Collaboration May not support effective team communication.
- Basic Features Lacks advanced tools for resource management and real-time adjustments.
3. Real-World Applications of using yFiles for the creation of a highly efficient Gantt Chart
- Building and Managing Projects For a construction project, use yFiles to visualize task dependencies and manage scheduling for subcontractors.
- Logistics and Dependencies In a software development sprint, automatically track task dependencies and adjust timelines as needed.
- Monitoring Progress For a marketing campaign, create a detailed Gantt chart to track milestones and adjust strategies in real-time.
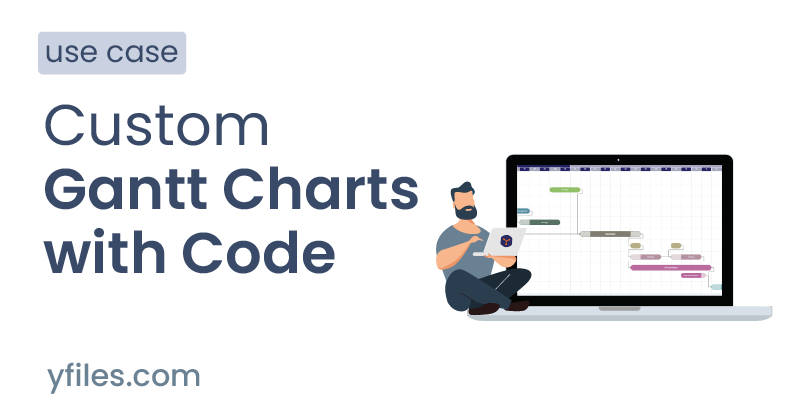
A Gantt chart visually organizes tasks along a timeline by displaying a task list on the left, a horizontal timeline on the right, and horizontal bars to indicate the duration and overlap of tasks.
About yFiles: The graph visualization SDK

yFiles is your go-to SDK for crafting advanced graph visualizations, whether you're working with Web, Java, or .NET technologies. Its unmatched flexibility and scalability enable you to convert complex data into clear, actionable visuals, fitting for both enterprise and startup needs.
With yFiles, you're equipped for the future—supporting any data source while maintaining strong data security. Getting started is seamless, thanks to over 300 source-code demos, thorough documentation, and direct access to core developer support. These resources are available even during your free trial.
Backed by 25 years of graph drawing expertise, yFiles is trusted by top companies worldwide for their most critical visualization tasks.
Discover yFilesWhy yFiles is the Top Choice for Developers, Designers, and Anyone Needing Professional Diagrams

yFiles Newsletter
Stay informed about yFiles, network visualization, and graph technology updates.
Join our newsletterWhy use yFiles for your Gantt chart creation?The most effective features and flexibility for stunning Gantt chart creation.
Unparalleled customization
Advanced features
Integration and compatibility
Performance and scalability
Rich feature set
Strong community and support
Start building your
first yFiles app today!
Download yFiles!How industry leaders optimize processes with yFiles' Gantt ChartsReal-World gantt chart Applications
Patient Onboarding
Scenario
Impact
Outcome
Compliance Tracking
Scenario
Impact
Outcome
Production Scheduling
Scenario
Impact
Outcome

Recap
Create and customize Gantt charts with code

Gantt charts are a foundational tool in project management, used to organize, schedule, and track tasks and milestones along a timeline. They enhance clarity, collaboration, and the ability to manage complex or large-scale projects by visualizing dependencies, resource allocation, and progress.
The yFiles SDK empowers developers to create fully customizable, interactive Gantt charts that support real-time updates, advanced resource and dependency tracking, and seamless integration with existing applications. With high-performance rendering and flexible layout algorithms, yFiles excels at handling projects of any size and complexity, providing features such as critical path analysis, baseline comparison, groupings, and dynamic styling. Details on these features can be found in the section Why use yFiles.
yFiles integrates easily with diverse development environments and platforms, ensuring broad compatibility for modern project needs. For practical examples and real-world usage, see the industry applications and try the Gantt Chart Editor Demo. Further related techniques can be explored in the BPMN Diagram Visualization and database relationships guides.
Related content
Got questions about
Gantt chart visualization?

Email: hello@yworks.com
Phone: +49 7071 9709050


