Resources for Effective Network VisualizationTools and materials to support your graph application development.
This section provides access to essential resources for working with graph visualization. Whether you're new to the topic, improving your implementation, or exploring advanced use cases, you’ll find relevant materials here. Discover interactive demos, live webinars, and industry-specific case studies to support your development process.
Get Started with Graph Visualization
The yFiles diagramming library provides the tools needed to create graph-based applications. Whether you're exploring its features for the first time or working on a prototype, a wide range of source code demos helps you get started and dive deeper into specific use cases.
Direct access to expert knowledge and well-documented examples ensures a smooth development process.
Try yFiles for freeWant to build your first web data visualization?
Get step-by-step instructions for your first steps with yFiles for HTML. This guide helps you with the initial setup, shows you where to start in the documentation, and explains how to create your first yFiles application.
Getting started with yFiles for HTML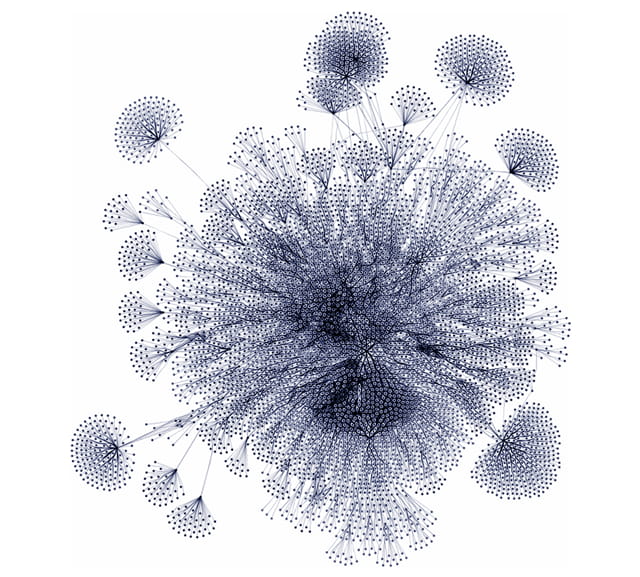
We´d love to help you. Reach out and we'll get in touch with you.
Your message has been sent.
Interactive Source Code DemosLearn techniques, experiment with layouts, and explore practical graph visualization examples.
The demos are included in the free evaluation package and come with full source code, making it easy to get started. Whether you're prototyping or developing production-ready solutions, they offer a solid foundation for implementation.

yFiles offers over 300 source code demos, covering every aspect of graph visualization and catering to a wide range of use cases. A comprehensive collection of categorized demos highlights the versatility of yFiles, from experimenting with layouts to building custom visualizations and analyzing complex data. These examples provide practical insights and inspiration for creating impactful applications.
Automatic layouts
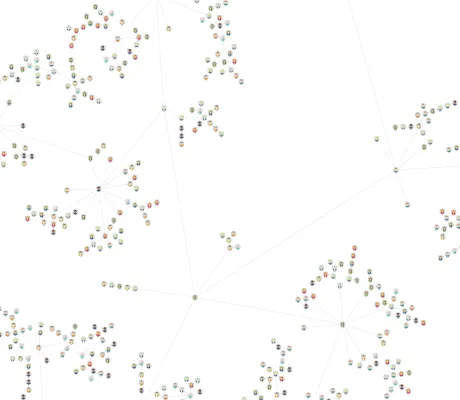
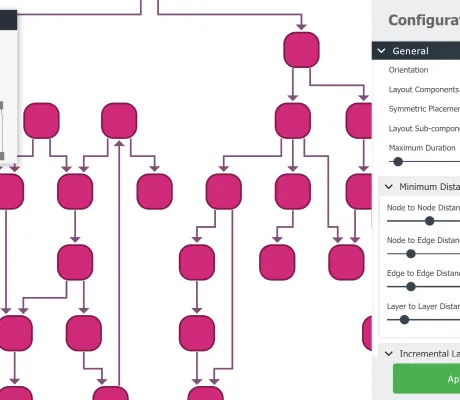
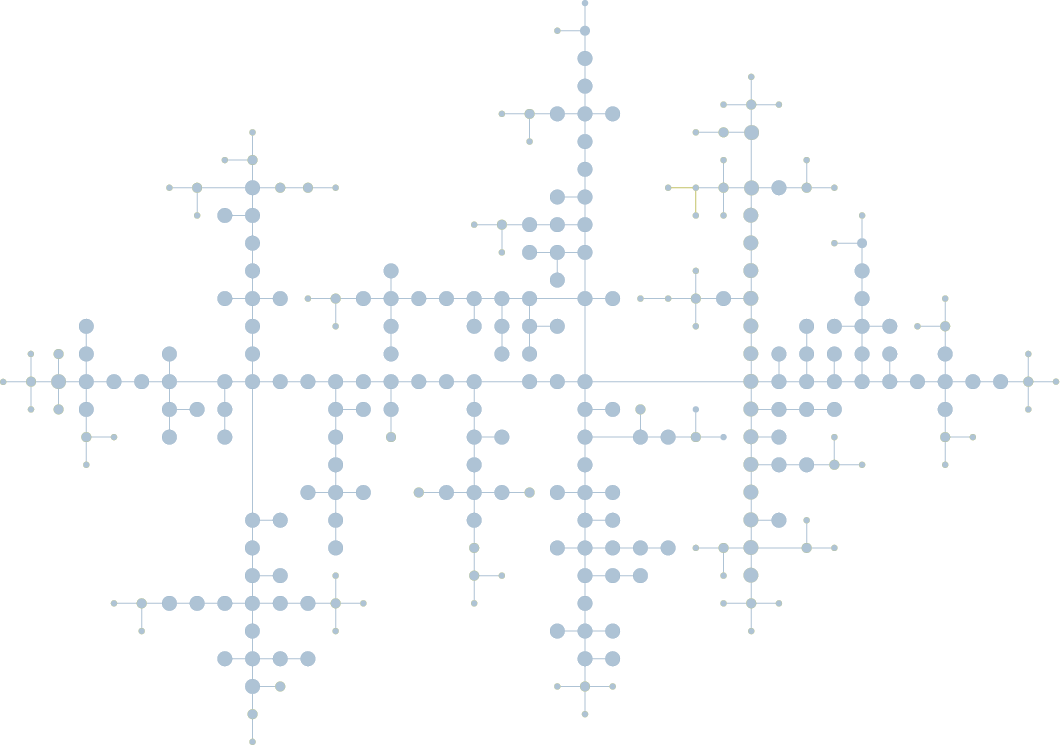
A unique feature of yFiles is its advanced automatic graph layout algorithms. These algorithms help you organize your data clearly and can be further configured to meet your specific needs. Watch these demos to see a variety of different layout algorithms in action.
Diagramming use cases
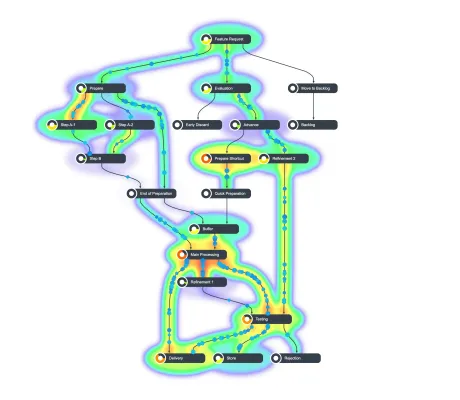
Take a look at and browse through a set of diverse use cases created with yFiles. The demos focus on the diagramming aspect and show how graph visualization help in the context of a specific use case.
Custom visualizations
With yFiles, you get unique visualizations with extensive customization options to present your users with exactly the information they are interested in. The following demos show different aspects of custom visualizations, both for graph elements such as nodes and edges, as well as for additional visuals that contribute to the visualization such as background, legend, overlay, etc.
Large graph visualization
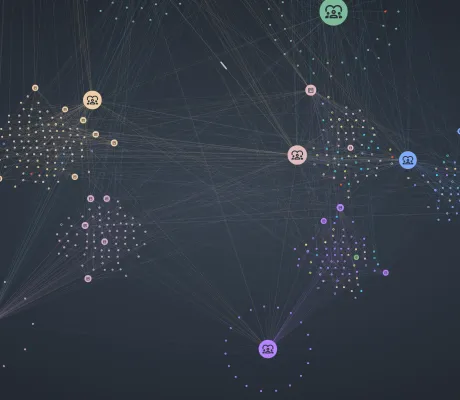
Rendering performance is an important aspect when large amounts of data need to be shown to the users. yFiles can leverage various technologies to achieve high-performance graph visualizations. See different approaches ranging from filtering and aggregation, over level-of-detail rendering, to hardware accelerated large-scale graph visualization.
Graph analysis
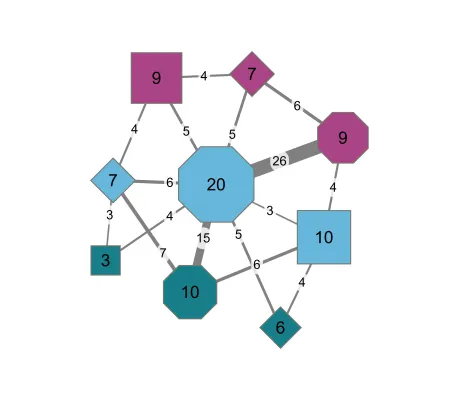
Graph analysis algorithms are a powerful tool in the yFiles library. Discover the strength of the yFiles graph algorithms and see how they can be used to create useful and informative visualizations.
And a lot of other source code demos as well.
Expand Your Expertise with WebinarsFree live sessions, recorded webinars, and in-depth series on graph visualization technologies.
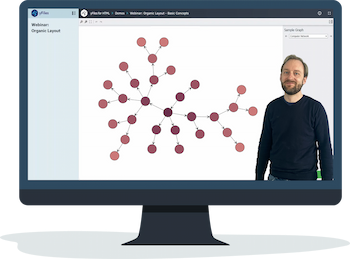
Join free live webinars hosted by yWorks to stay up to date and ask questions in real time. For details on upcoming sessions, click here.
Recommended Webinar Series
- Graph Layouts in yFiles: A deep dive into layout algorithms like hierarchical, organic, and tree layouts, presented by Dr. Benjamin Niedermann.
- The Art of Graph Visualization: Learn how to create clear, effective graph visualizations with best practices tailored for developers and visualization experts.

yFiles Newsletter
Stay informed about yFiles, network visualization, and graph technology updates.
Join our newsletter


