React Supply Chain ComponentIntegrate supply chains in React applications using a powerful and versatile React component
Visualize complex supply chains directly in your React application — interactive, customizable, and production-ready. This component, powered by yFiles for HTML, lets you easily integrate advanced supply chain graphs with grouping, folding, tooltips, and more. Whether you're analyzing dependencies, identifying bottlenecks, or tracking material flows, this versatile component gives you full control.
Supply chain management encompasses the comprehensive oversight of the entire journey of goods or services, from their initial raw components to the ultimate delivery of the final product to consumers. It involves the establishment of a network of suppliers who facilitate the movement of products, starting from raw material suppliers through various stages of production, distribution, and ultimately reaching end-users or consumers.
SCM deals with tasks such as logistics management, inventory management, supply chain optimization and is faced with challenges such as supply chain visibility, forecasting, supplier relationship management and transportation logistics optimization affecting mostly modern day large supply chains.
The fundamental goal of supply chain management in business is to enable manufacturers to produce the right quantity of products to satisfy market demand while aiding retailers in minimizing inventory and reducing the expenses associated with storing products.

The open-source web application framework, React, continues to stand out as a top choice for web developers. However, building a supply chain visualization in a React application can be challenging.
Developers can use various component frameworks that simplify the creation of modern web applications. Leveraging React’s component-based approach makes the tailoring to specific use cases much easier. In a web application that uses React, think of components as building blocks for different parts of the webpage.
yFiles for HTML offers a highly adaptable React component. This component is specifically designed to simplify the visualization of supply chains within a React application.
What is yFiles exactly? Well, yFiles for HTML is a commercial programming library explicitly designed for graph, network, and diagram visualization.
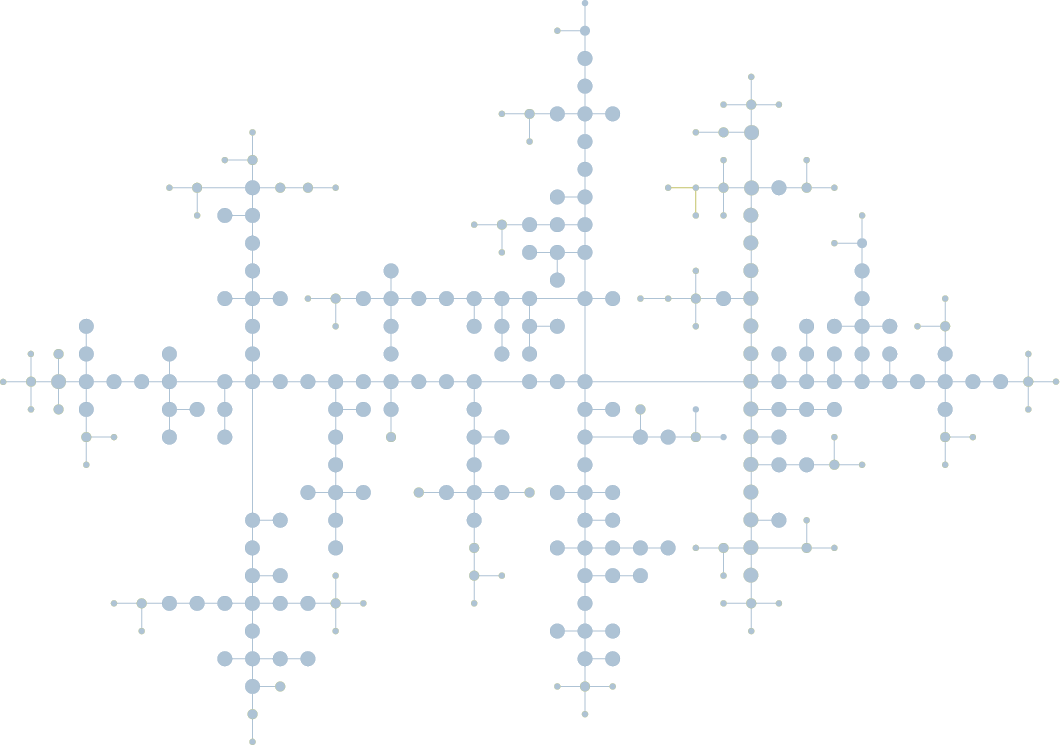
Note that the word "graph" here refers to the mathematical graph with nodes and edges, rather than a function graph or bar charts.

Directed acyclic graph

Directed graph

Undirected network graph
yFiles' built-in user input handling makes the graph visualization highly interactive with keyboard, mouse, or touch gestures.
Because of the flexible style options, the graph visualization can be tailored to any domain. Have a look at the various use cases yFiles can cater to.
In addition, its sophisticated layout algorithms let you easily create clear, stunning, and highly complex graph visualizations.

Powerful Graph Visualizations with yFiles
yFiles gives you the tools to create clear and scalable graph visualizations for graph databases. With advanced automatic layouts, you can focus on analyzing and optimizing your graph data instead of arranging nodes manually.
Leverage interactive features, animations, and flexible styling to build dynamic graph applications. yFiles seamlessly integrates with web technologies, making it easy to bring data to life in any application.
Start visualizing your database graphs with yFiles today!
Prototype your own graph application

We´d love to help you. Reach out and we'll get in touch with you.
Your message has been sent.
How can the yFiles React supply chain component optimize supply chain management?
The yFiles React component for supply chain management has all the features and capabilities to significantly optimize supply chain management.
Read on to discover how this component can help you to easily create intricate supply chain management React apps.
Providing you with a visual overview of your data, with drill down options and various customisation choices almost instantly.
Making it easy for you to visualize and delve deeper, quickly switch to any level and see what’s happening there to help you make the right choices for your SCM processes.
React supply chain component example
Supply chain component creation
The first step consists of collecting all the data from all your sources that you want to visualize. This is often done by querying a database like Neo4J and transforming the query result into the required JSON format. The data format used by the component is simple, versatile and extensible. On the simplest level it is a list of item and connection definitions. Once all your data is neatly organized into items and connections you are ready to feed this output into the component and instantly see your data come alive. The component can handle a very large amount of supply chain items, basically only limited by the browser’s technical capacity.
To sum up, the process is as follows:
- Where is my data and what data do I really need? How do I access the data? Do I query a database?
- “Load” the data from the source via the standard method.
- Convert your dataset into a list of items and connections in the supported JSON format.
- Feed it into the component.
- Get an instant overview of your dataset at a glance!
Thus, integrating a sophisticated supply chain component in a React application is as easy as this:
Discover the yFiles React Supply Chain Component through the yFiles Playground, an optimal platform for getting acquainted with the component and its functionalities.
Investigating the visualized data
Once you have your dataset loaded into the yFiles React Supply Chain Component, you can start viewing the information on the items and connections.
Grouping and folding
The component supports multi-level supply chain data. For example, products can be grouped into processing units, which can then be grouped into geographical sites. When initially loading the supply chain data, the graph can be collapsed to only show top level groups, so that you can simplify complex graphs and identify patterns or structures within them. As internally the complete graph is available in the browser, it can then be expanded without loading new data. Either single items can be expanded with a mouse click or all elements in the graph can be expanded at once.
In summary, the yFiles React Supply Chain component allows you to effortlessly group related nodes together based on certain criteria, and at the same time allows you to collapse or condense parts of the graph to reduce its complexity while preserving important structural information.

Item visualization
The component provides versatile default implementations for simple and grouping items. The simple item visualization shows all item properties in a tabular fashion, whereas the grouping visualization displays the number of items contained in the group.

The yFiles React Supply Chain Component enables a high level of customization in visualizing items.
This is achieved by utilizing custom React components to render items based on specific requirements.
Custom visualization of items
The following code snippet exemplifies how this customization can be seamlessly integrated into your web application.
Connection labels
Every connection can have a configurable label displaying connection data. When using folding, the connections between two collapsed group items are also folded. It is easily possible to also provide a label for such a folding edge, summarizing the data of the contained “simple” edges.
Customizable connection visualization of items
Tooltips
Tooltips provide an easy to use solution for displaying data on any zoom level and for any element in the graph.
This way you can have additional context or details relevant to the specific element being hovered over.
Naturally enhancing user experience and conveying information effectively. As with all the other visualization items,
it is also quite simple to provide custom tooltip renderers.
Item tooltip example
Heatmap
The heatmap tool is a great way to highlight parts of the supply chain where “a lot is happening”.
The values for the heat visualization can be calculated by a custom function which can use the item and connection data as input variables.
For example, when filtering for the genealogy of one node, the heatmap in the component can show which sourcing items
are the most production intensive and which transport flows have the largest material flow. It’s all pretty impressive and at the same time very straightforward to implement.
React supply chain with heatmap function
Search
It is easy to search for any data in the visible items using the built-in search feature. Matching items are instantly highlighted, and when hitting a configurable key, can be brought into the viewport.
Supply chain search feature
Context menu
The yFiles React Supply Chain Component comes with a list of options that appear when you interact with an object, by right-clicking on it.
Providing you with relevant commands based on the current context, allowing you to perform actions quickly.
Context menu for additional item options
Context menu for additional item options
Graph overview
Of course, you will want a high-level summary or visualization of the structure and key characteristics of your data. Providing you with a quick glance at the graph’s components, such as nodes and edges, as well as any relevant metrics or attributes associated with them.
Helping you to grasp the overall layout and organization of the graph, thereby facilitating understanding and analysis of the underlying data or relationships.
React supply chain graph overview
Filtering and highlighting
The yFiles React Supply Chain Component provides functions to highlight connected items and to filter the graph for an item genealogy without loading and reloading any data.


Image export and printing
Last but not least, it is possible to export the visualized flow to various image formats or print it through the browser’s printing functionality.
About yFiles: The graph visualization SDK

yFiles is your go-to SDK for crafting advanced graph visualizations, whether you're working with Web, Java, or .NET technologies. Its unmatched flexibility and scalability enable you to convert complex data into clear, actionable visuals, fitting for both enterprise and startup needs.
With yFiles, you're equipped for the future—supporting any data source while maintaining strong data security. Getting started is seamless, thanks to over 300 source-code demos, thorough documentation, and direct access to core developer support. These resources are available even during your free trial.
Backed by 25 years of graph drawing expertise, yFiles is trusted by top companies worldwide for their most critical visualization tasks.
Discover yFiles11 reasons why React developers trust yFiles!
Examples and source code
The yFiles React Supply Chain Component comes with numerous example applications showcasing how to integrate and customize the component within a React application. You can find the source code of these applications on the yWorks GitHub repository.
To integrate the yFiles React Supply Chain Component in your React application, follow these steps:
- Download the trial version of yFiles for HTML at the yWorks Customer Center.
- Install the Supply Chain component via npm:
npm install @yworks/react-yfiles-supply-chain - The supply chain module has certain peer dependencies that must be installed within your project. Since it is a React module,
reactandreact-domdependencies are needed. - Before using the component, copy the trial license of yFiles for HTML into your project.
- Add the component in your application.
- For more information on how to use the component, refer to the accompanied documentation.
Explore the seamless integration of the yFiles React Supply Chain Component into your React application! The following concise code snippet will give you an impression of how easy it is to integrate this powerful yFiles component:
Click image to go to the getting started documentation
Benefits
Here are 10 benefits of integrating the yFiles React Supply Chain Component into your React application:
- Streamlined supply chain data representation and visualization.
- Enhanced decision-making through comprehensive visualizations.
- Reduction in operational costs and resource optimization.
- Improved collaboration and communication among stakeholders.
- Proactive risk mitigation and disruption management.
- Optimization of supply chain performance and customer satisfaction.
- Support for sustainability initiatives and environmental responsibility.
- Transparency into supply chain networks and ethical sourcing practices.
- Simplified creation of visualization tools without extensive development efforts.
- Instant visualization and drill-down options for quick insights and analysis.


