Diagramming for Supply Chain ManagementVisualize and optimize supply chains—with graphs!
Traditionally associated with manufacturing processes, supply chain management is equally important for the provision of any good or service, whether physical, face-to-face, or purely digital.
SCM is today better thought of as “managing the chain of supplies” – and that chain can include any
value adding resource, from raw materials to human skills and from factory machinery to social media
marketing.
Tasks such as demand forecasting, distribution network optimization, and efficient warehouse management are integral aspects of SCM.
In general, SCM is dedicated to the systemic, strategic coordination of the functions and processes within the value adding chain, aiming to optimize the performance of both the individual components and the supply chain as a whole.

Our diagramming SDK, yFiles, lets you map and visualize complex supply chains, in order to then analyze and optimize them based on real-time insights. Replacing clumsy spreadsheets with flexible, interactive diagrams provides a comprehensive and dynamic view of even the most convoluted supply chains.
Supply chain or supply network?
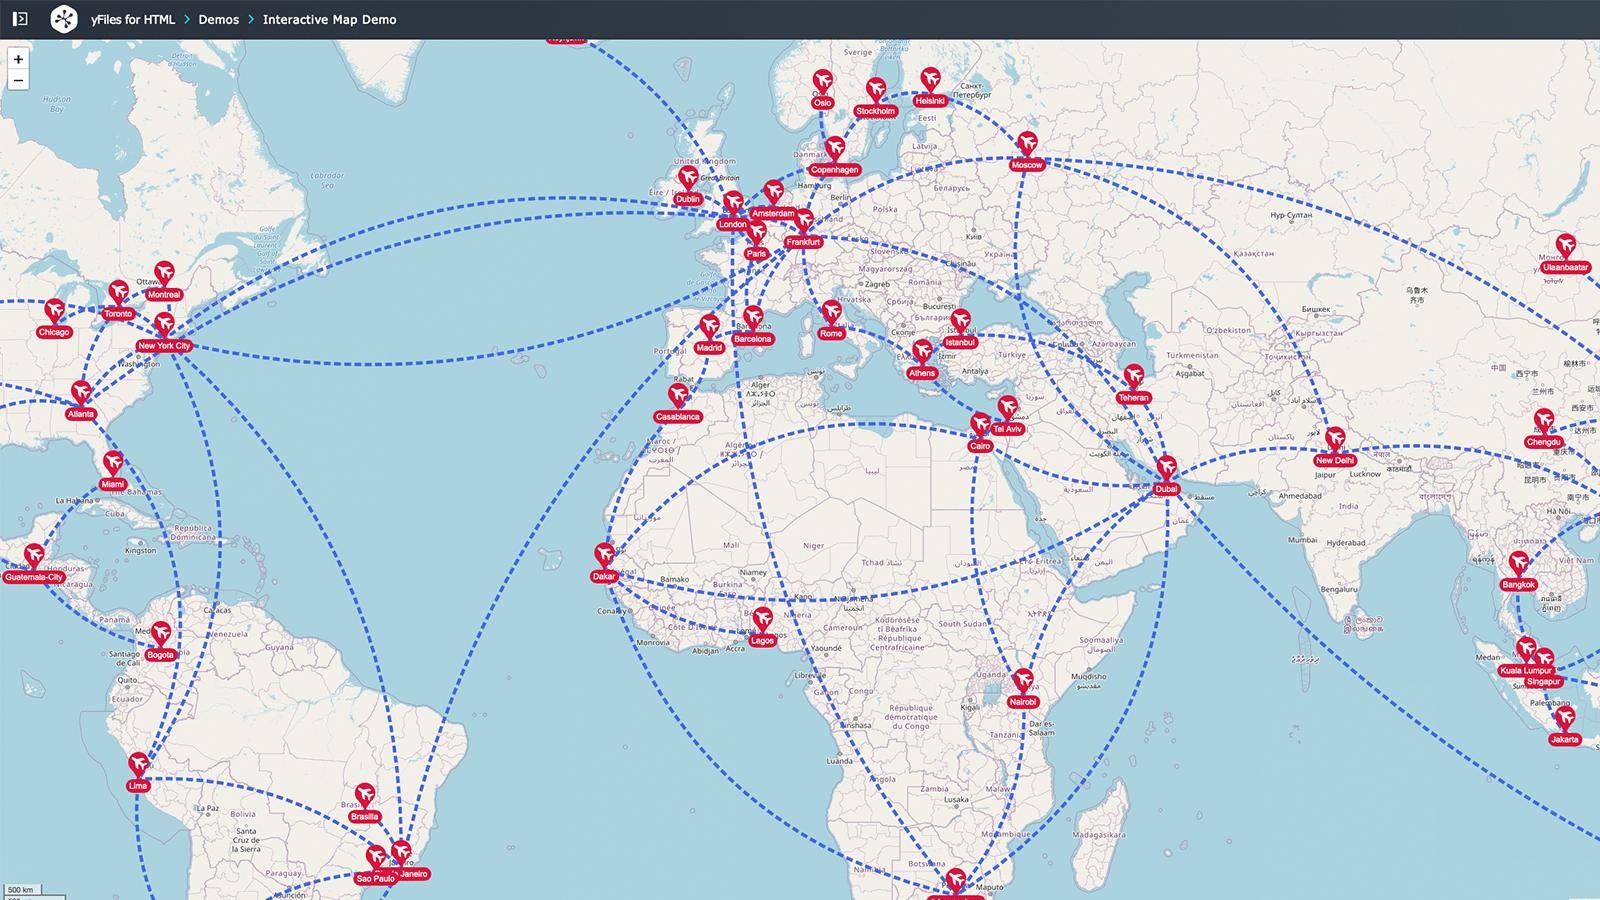
Even the most basic supply chains are getting longer and more complex – often with dozens of links, branches, and dependencies. In fact, it’s often more appropriate to speak of a “supply network” designating the many complicated and multifaceted layers of any given supply chain.
The more complex these interlocking processes get, the more critical it is to visualize the data accurately and comprehensively. With so many moving parts, it’s vital for managers and analysts to be able to pinpoint areas where delays, bottlenecks, or other issues arise.
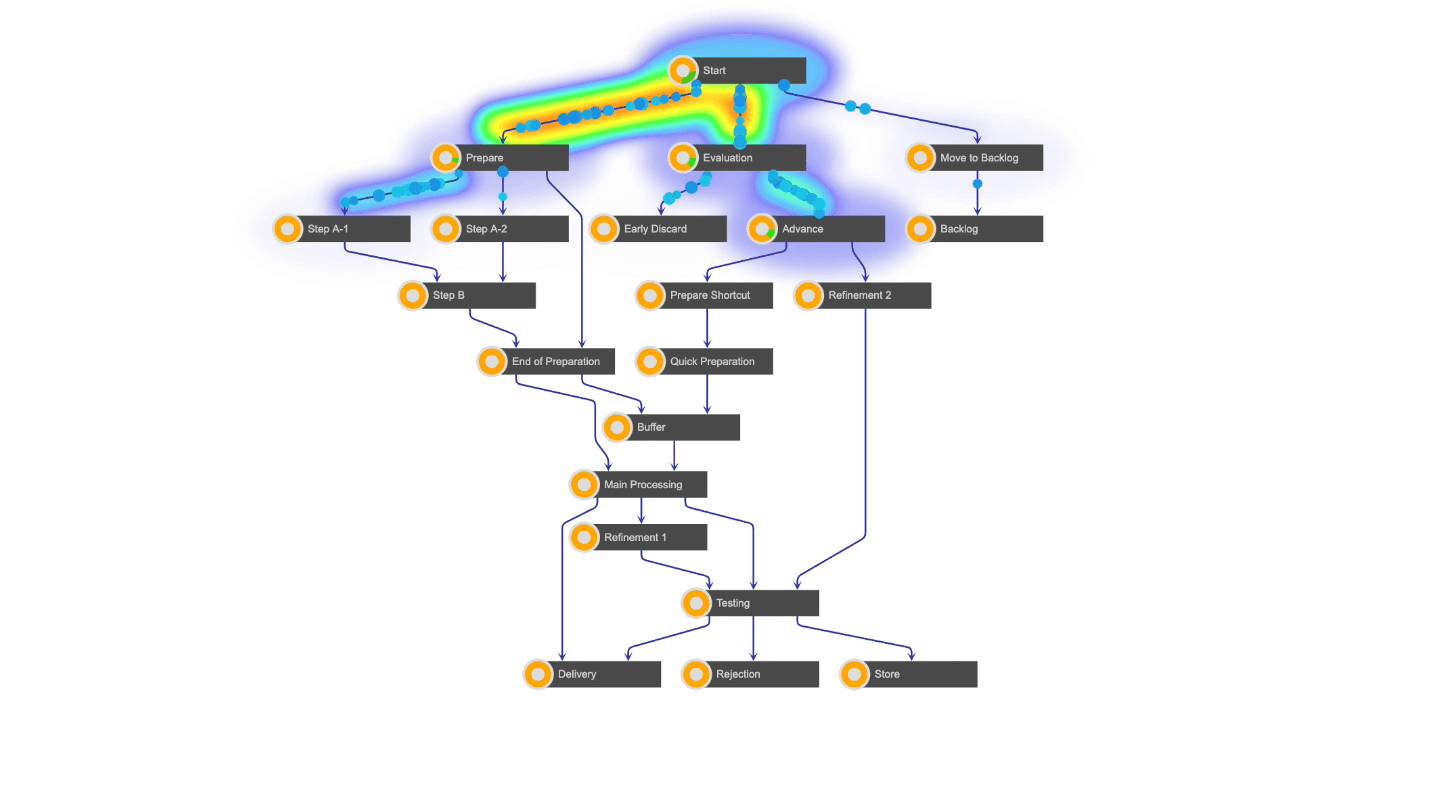
By employing interactive graphs that are capable of process mining and visualization, management of even the most complex supply networks can become very intuitive and more efficient.
Building visualization tools from scratch is costly and time-consuming. Luckily, there is already a mature, highly customizable library of ready-to-use components available: yFiles.
yFiles simplifies supply chain mapping, making data silos and clumsy spreadsheets a thing of the past!
Did you know?
Our diagramming SDK can import data from any source – including Excel, JSON files, relational databases, graph databases, and everything you can access programmatically.
We´d love to help you. Reach out and we'll get in touch with you.
Your message has been sent.
About yFiles: The graph visualization SDK
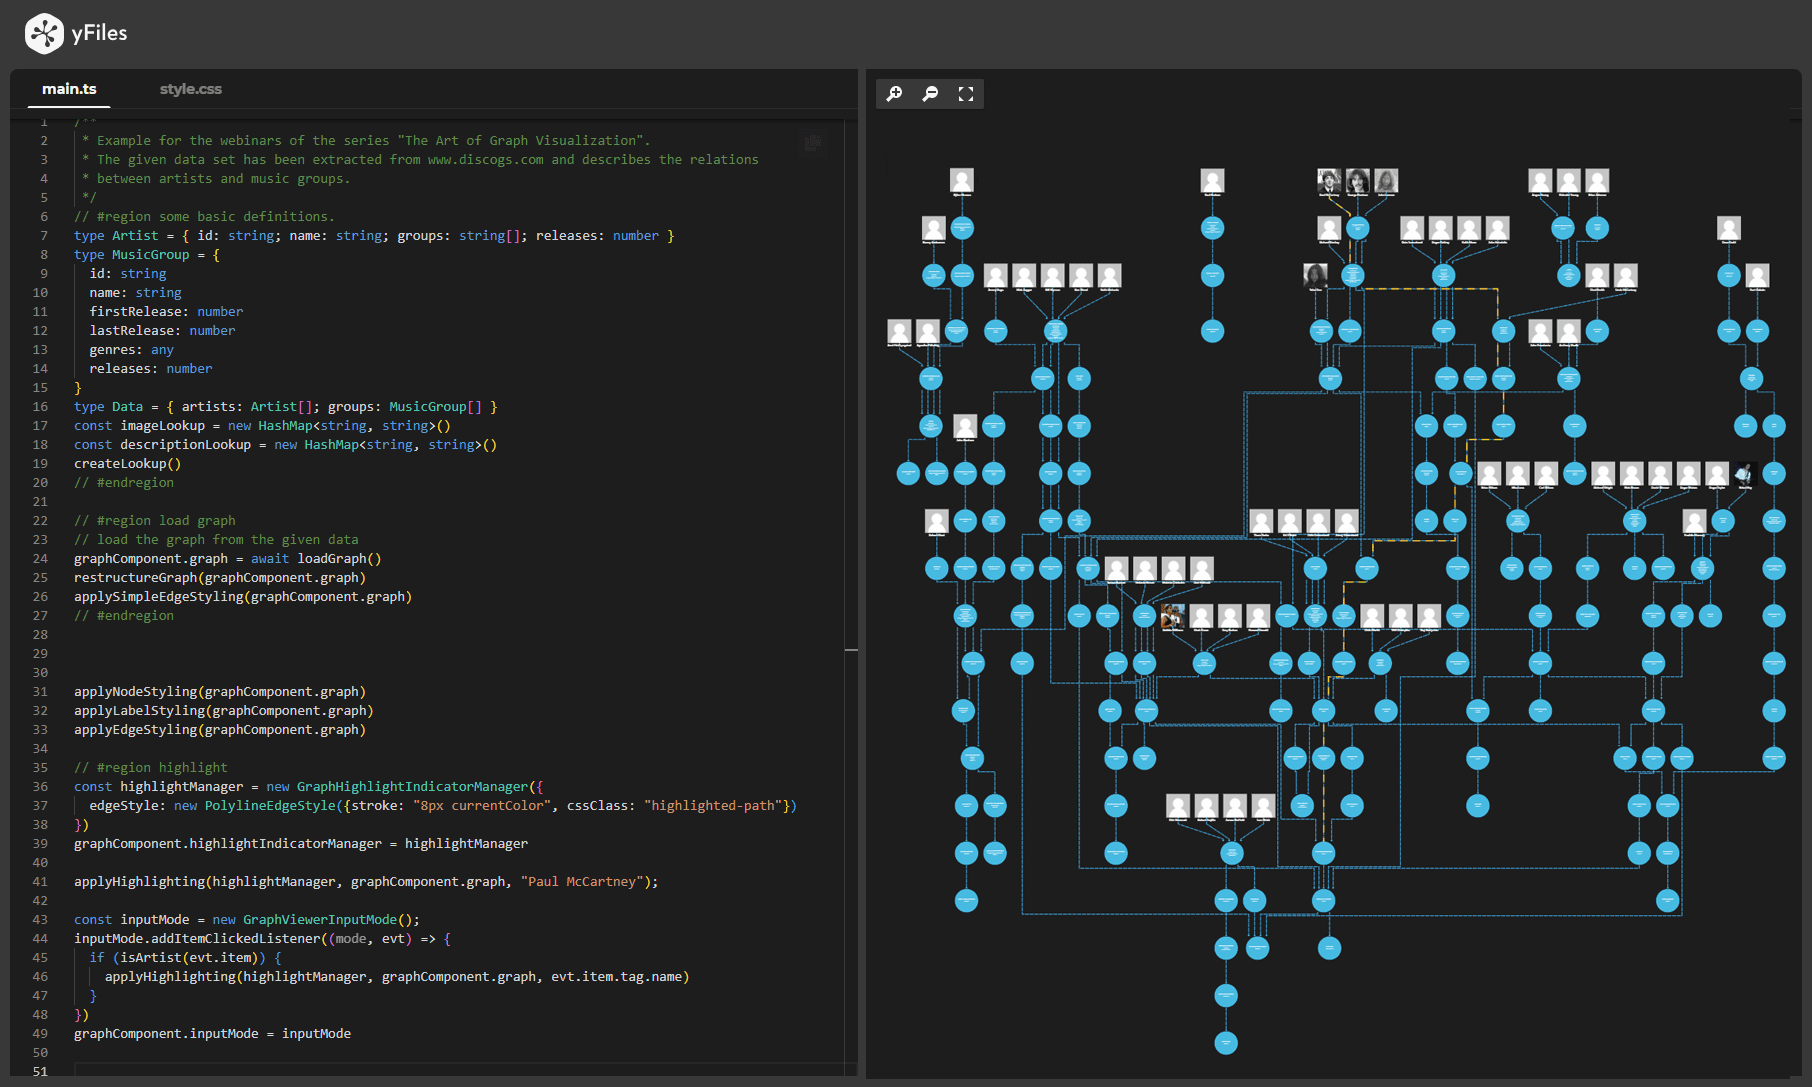
yFiles is your go-to SDK for crafting advanced graph visualizations, whether you're working with Web, Java, or .NET technologies. Its unmatched flexibility and scalability enable you to convert complex data into clear, actionable visuals, fitting for both enterprise and startup needs.
With yFiles, you're equipped for the future—supporting any data source while maintaining strong data security. Getting started is seamless, thanks to over 300 source-code demos, thorough documentation, and direct access to core developer support. These resources are available even during your free trial.
Backed by 25 years of graph drawing expertise, yFiles is trusted by top companies worldwide for their most critical visualization tasks.
Discover yFiles11 reasons why developers choose yFiles, the superior diagramming SDK

yFiles Newsletter
Stay informed about yFiles, network visualization, and graph technology updates.
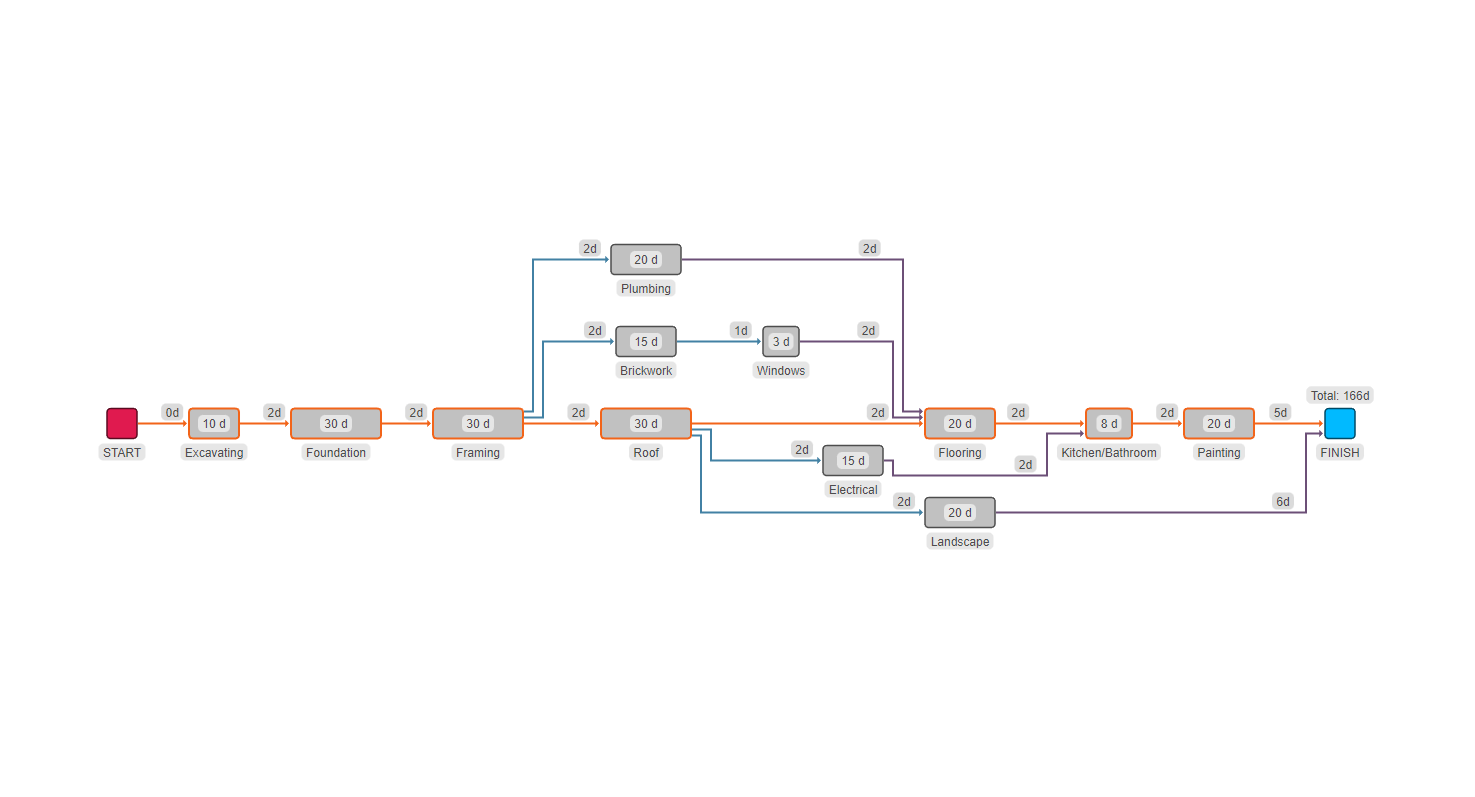
Join our newsletterSupply chain planning
Interactive live demos
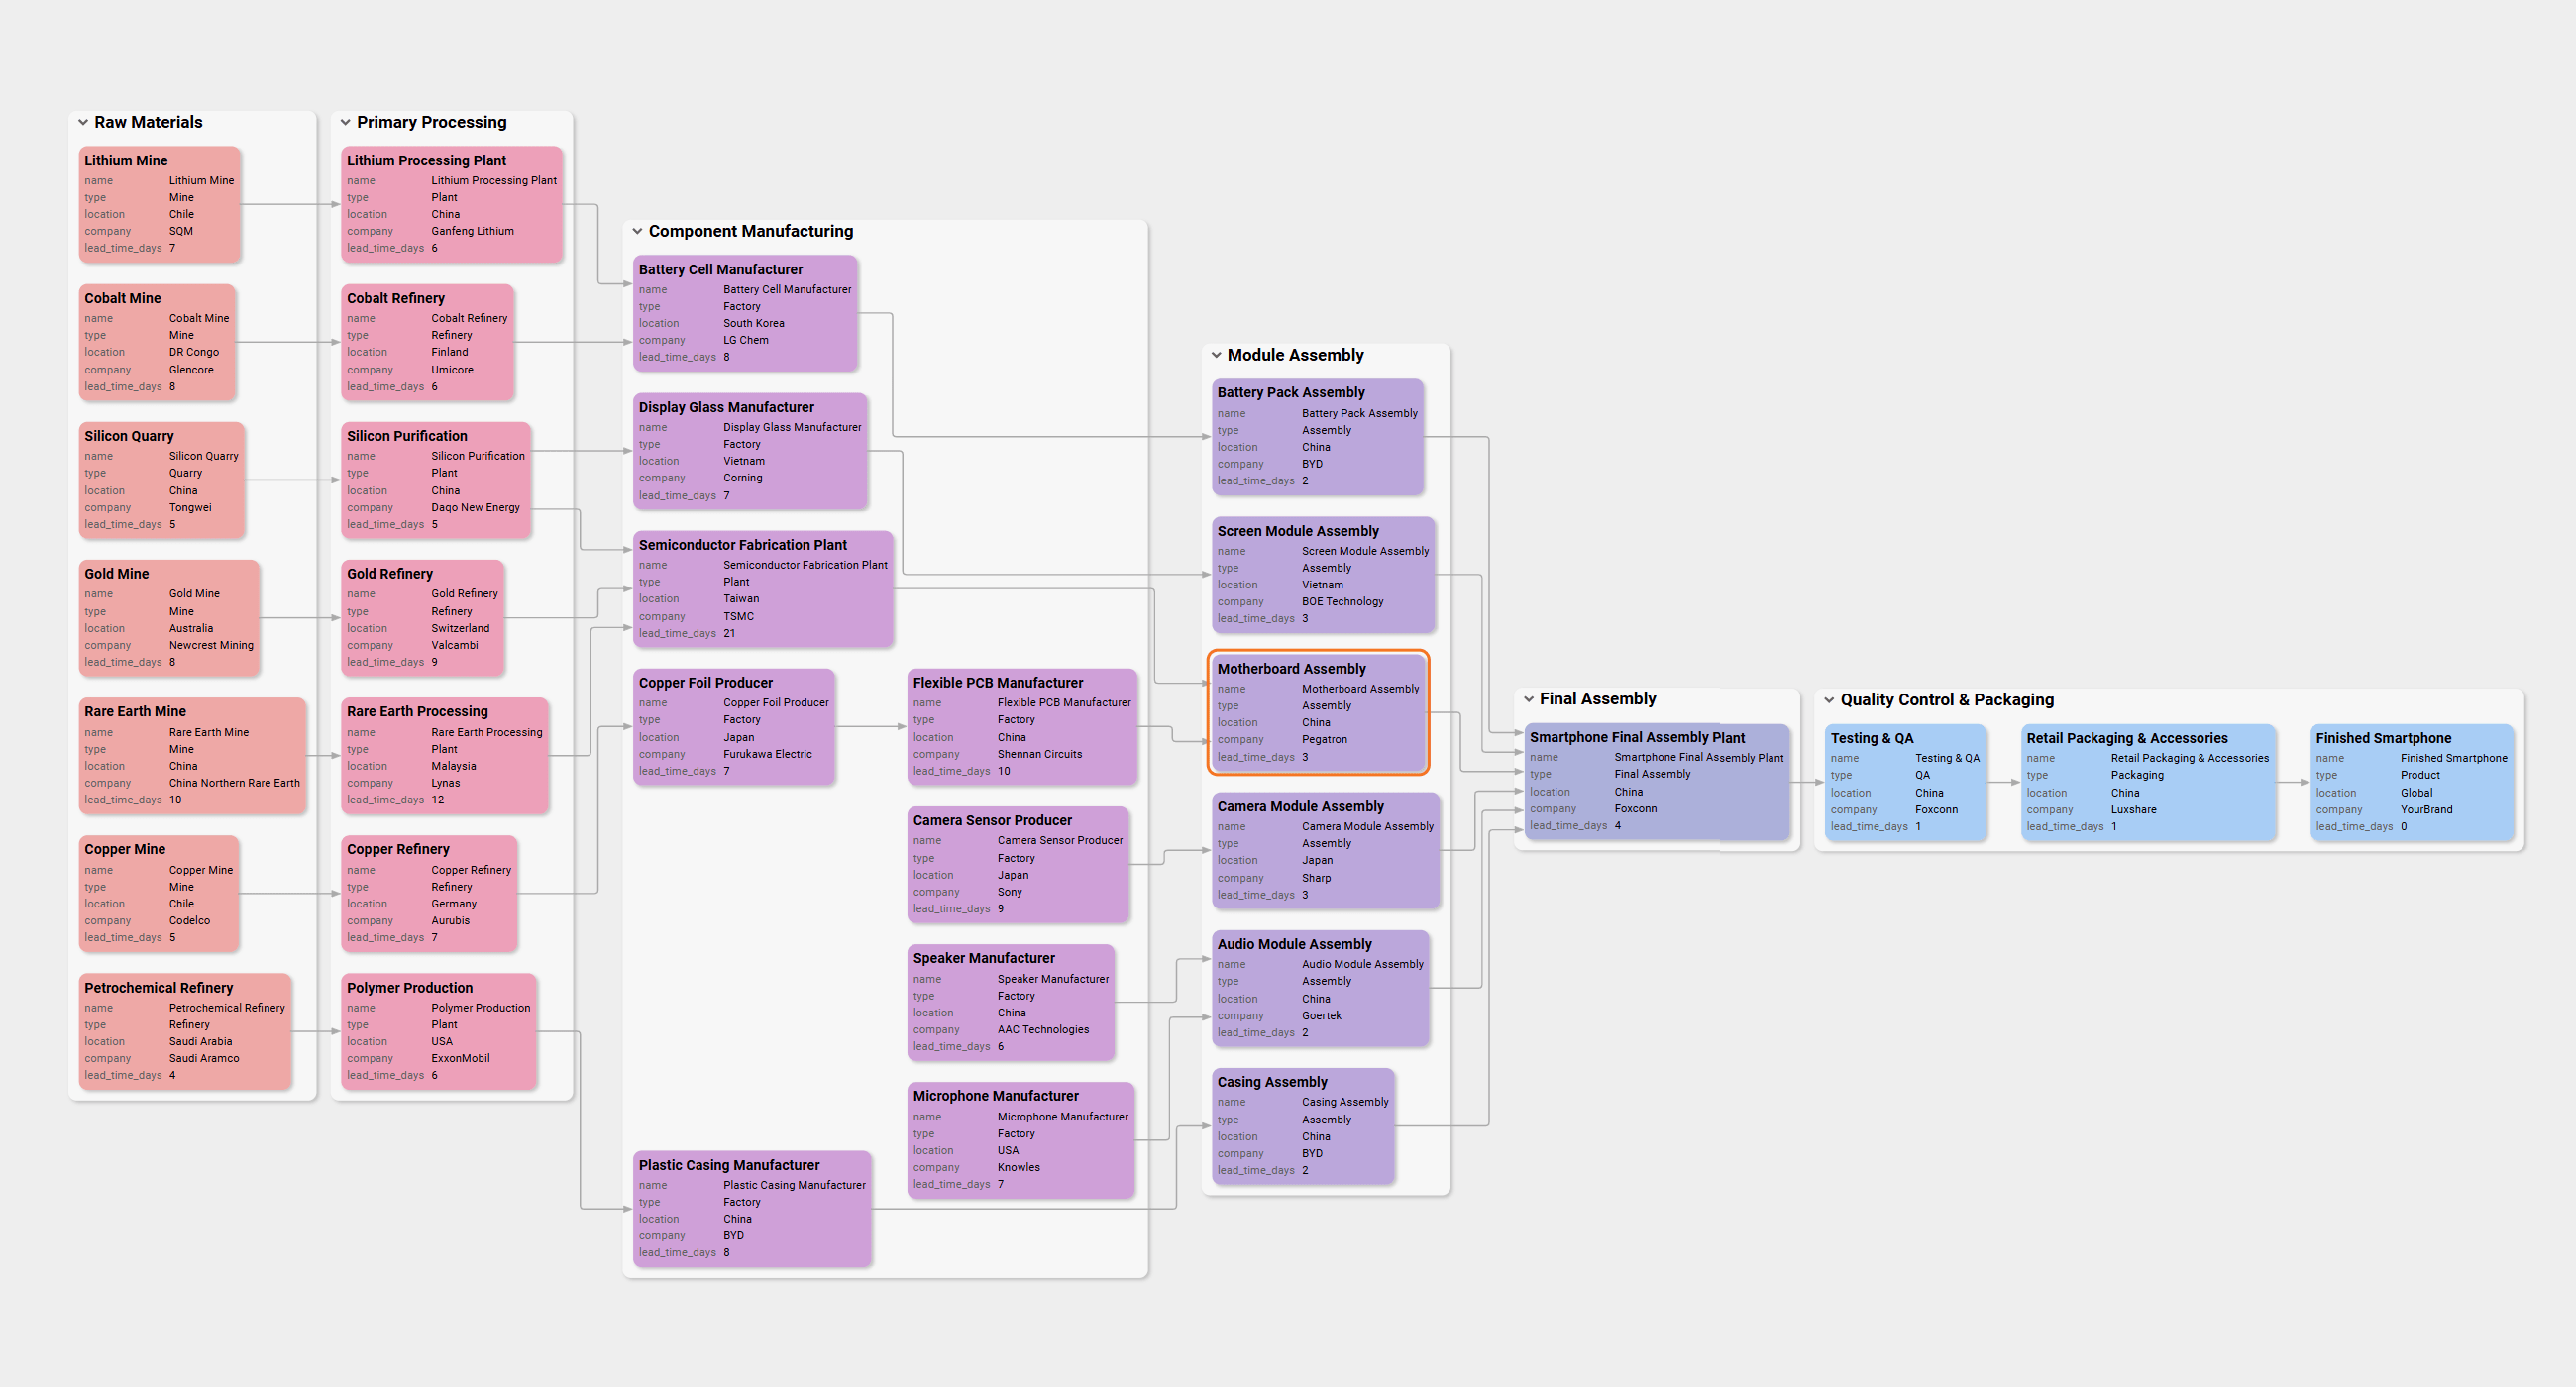
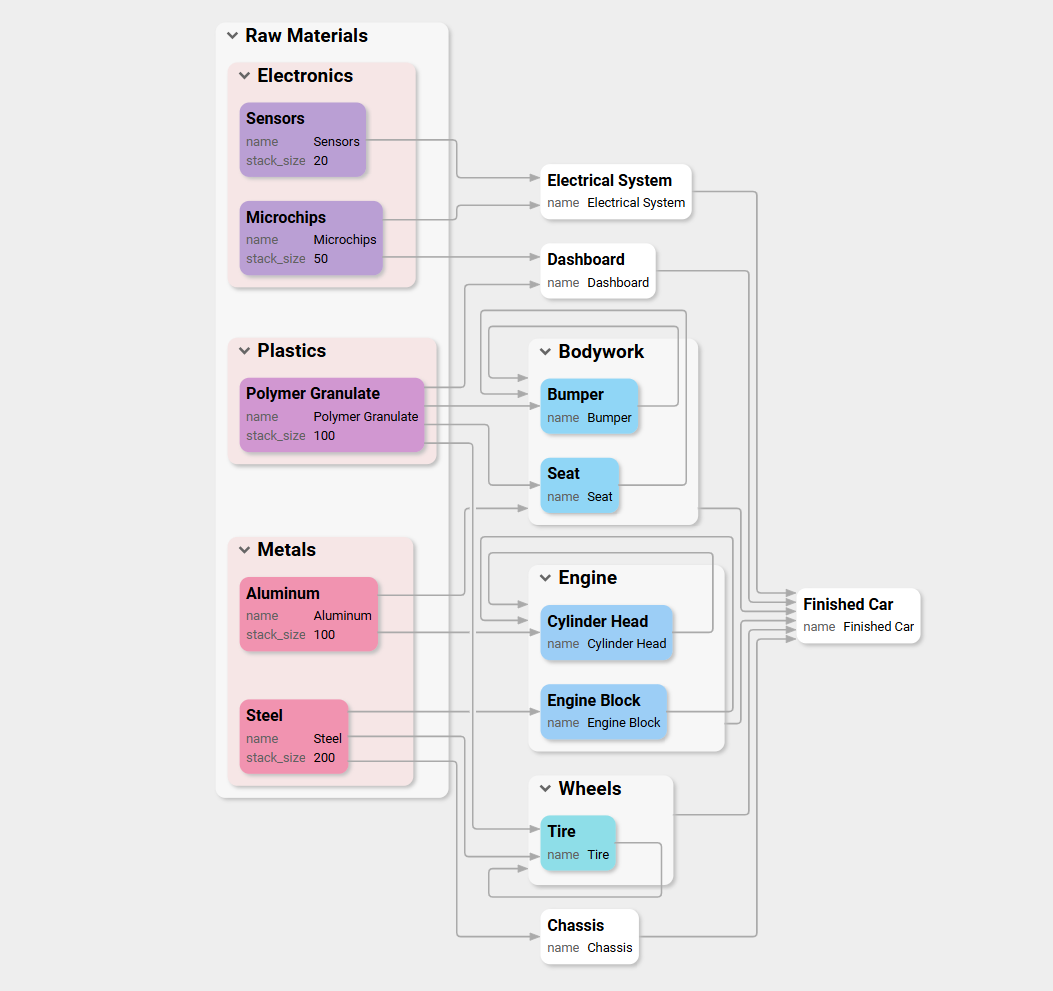
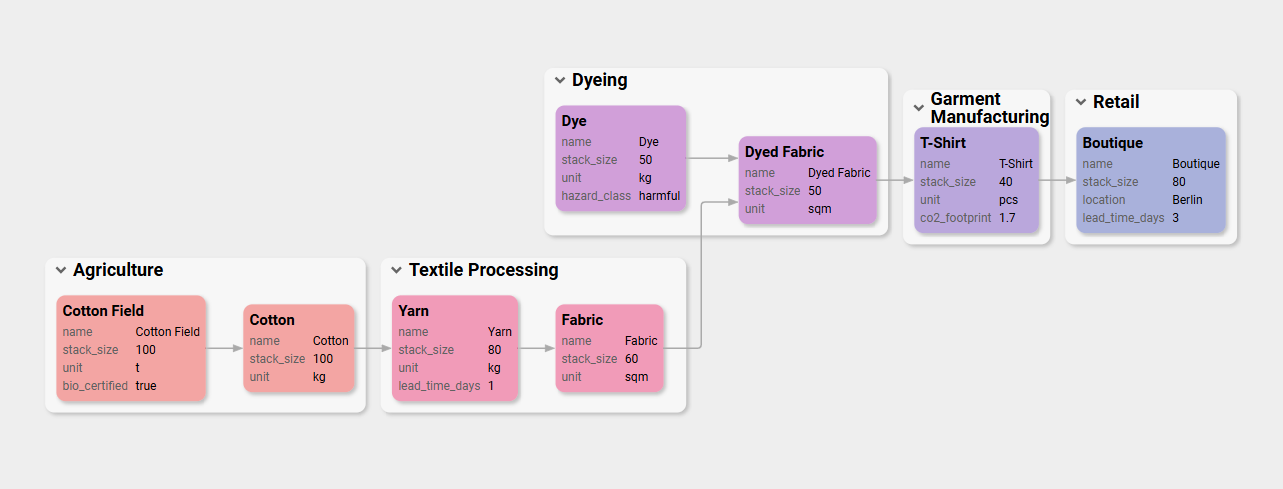
yFiles React Supply Chain Component
Our powerful and versatile React component based on the yFiles library, allows you to quickly incorporate dynamic and interactive supply chain diagrams seamlessly into your applications.
This enhances the user experience and facilitates an intuitive exploration of complex manufacturing processes, allowing users to gain insights into their supply chain data.
Read moreDocumentationGithubnpm
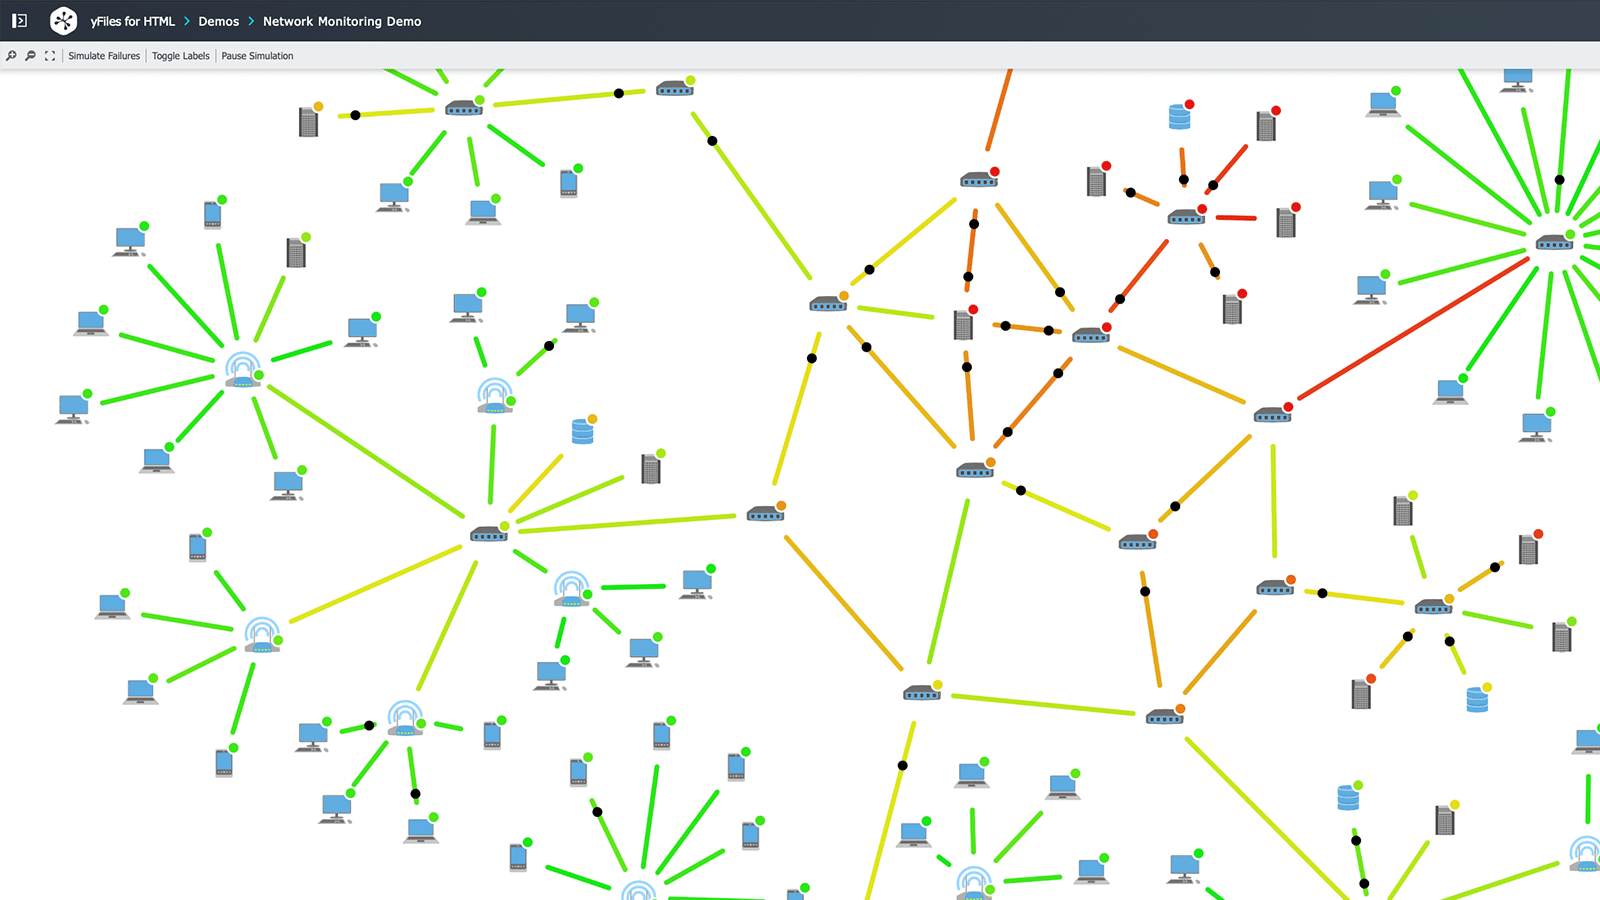
Supply chain simulation
Interactive live demos
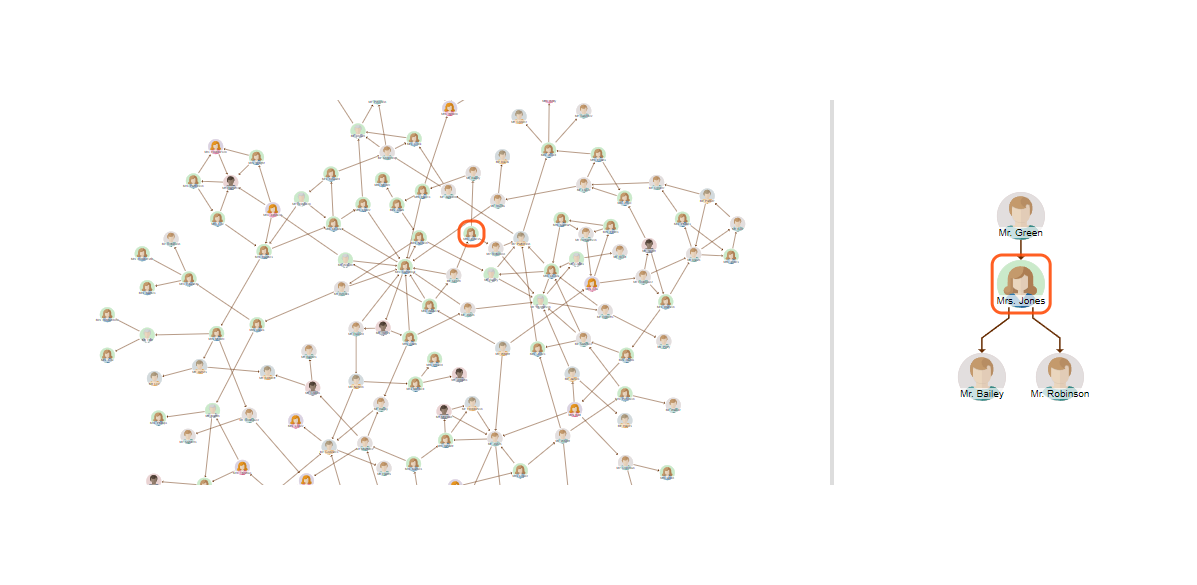
Supply chain analysis
Interactive live demos
Supply chain optimization
Discover yFiles React supply chain component examples
And you can do even more with yFiles
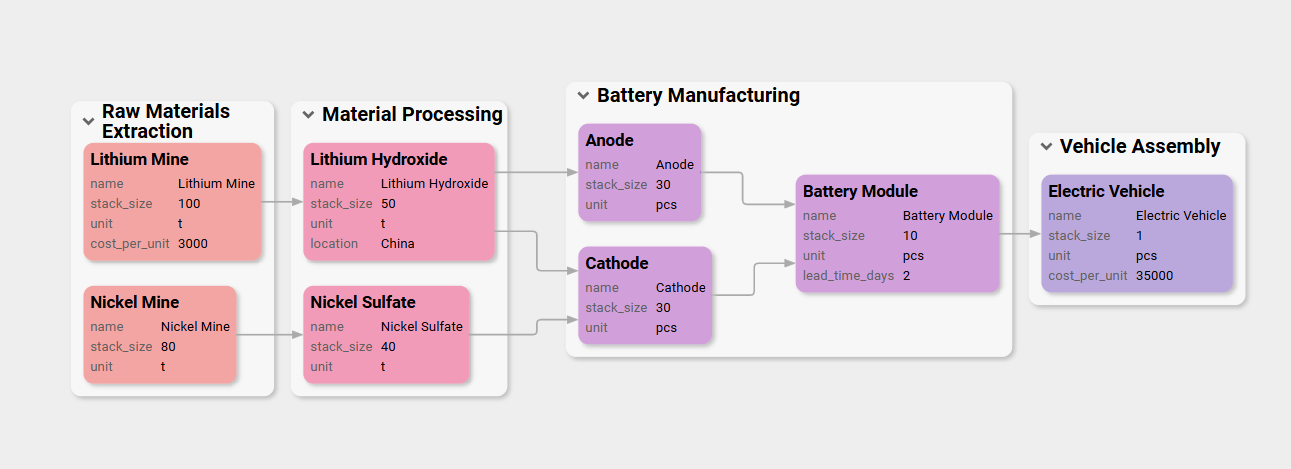
Many approaches can be used to design, monitor, and continuously improve processes. yFiles supports all of them – from depicting very large datasets and using visualizations like BPMN diagrams, flowcharts, network diagrams, and data flow diagrams to planning the movement of goods within your company. yFiles also provides many opportunities for analyzing data and generating insights.
Explore the interactive live demos that show the SDK’s strengths in supply chain management. The source code of the demos is included in yFiles – even in the free trial!
By the way, yFiles has a special talent: It adapts to any model, method, and scenario. Yes, even the ones we haven’t thought of yet. Just get in touch! Together, we’ll see how yFiles can meet your diagramming needs.
Recap
Diagramming for supply chain management

Supply chain management (SCM) is essential for coordinating and optimizing the flow of materials, resources, and information across interconnected networks of suppliers, manufacturers, and distributors. As supply chains become more complex and dynamic, effective visualization and analysis are crucial for ensuring efficiency, identifying bottlenecks, and supporting data-driven decision making.
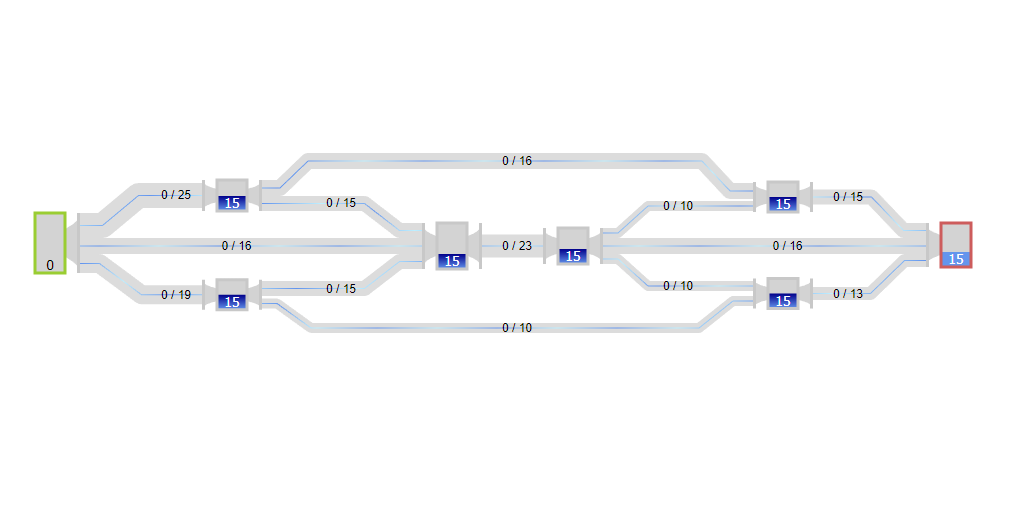
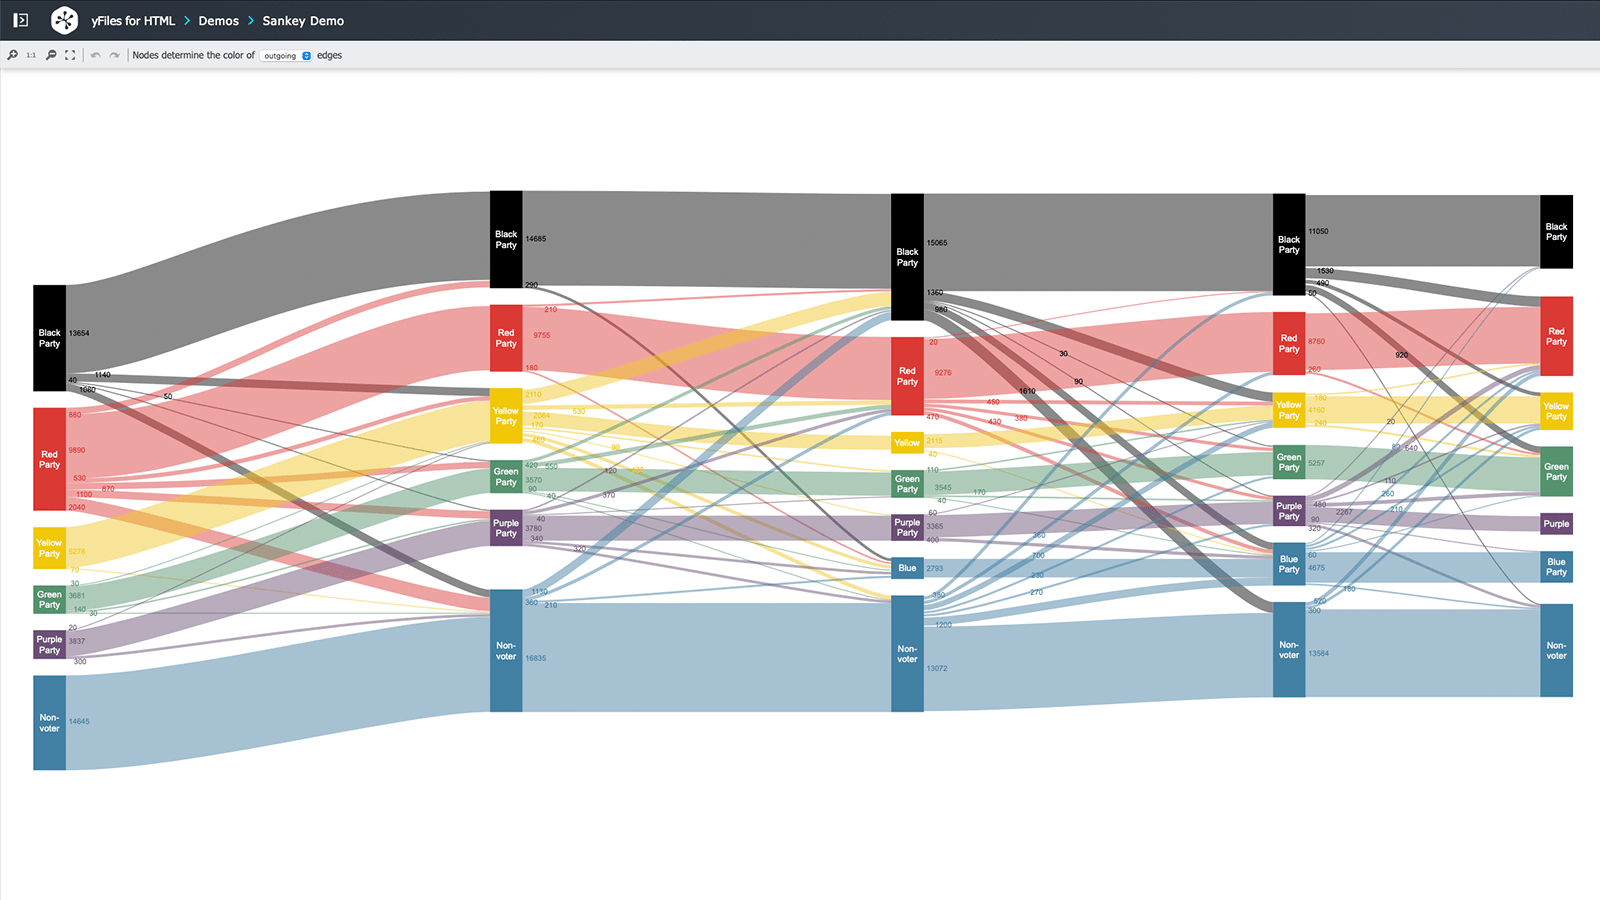
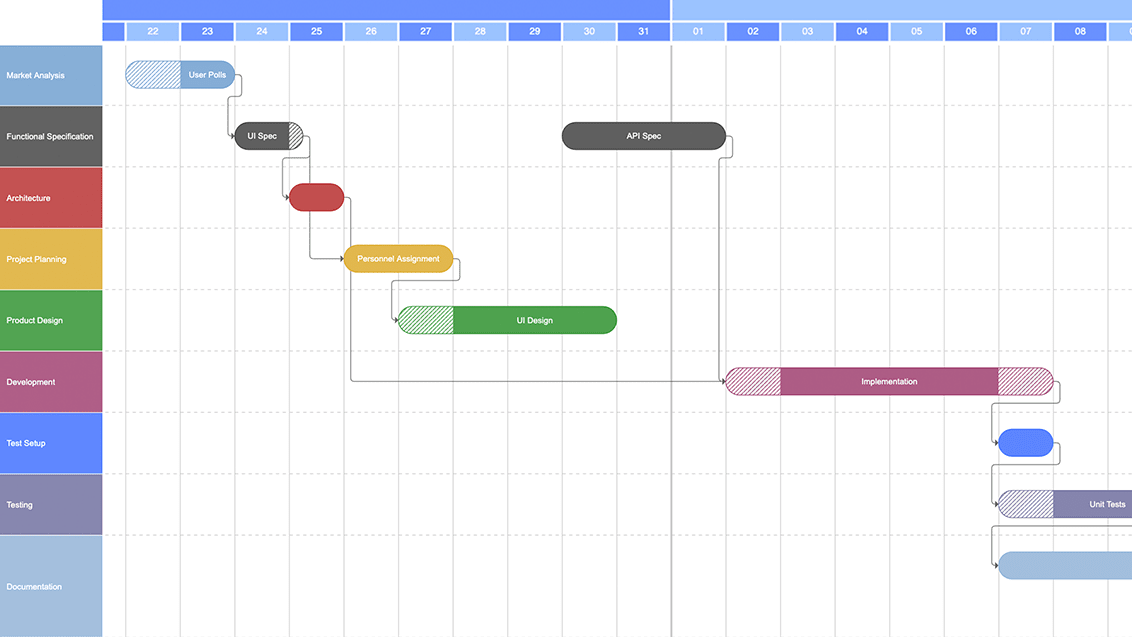
The yFiles SDK enables businesses to replace static spreadsheets with flexible, interactive diagrams that offer a comprehensive view of even the most intricate supply networks. With advanced capabilities for dynamic planning, simulation, analysis, and optimization, yFiles supports supply chain mapping, network flows, Sankey diagrams, Gantt charts, and interactive aggregation. Users benefit from customizable layouts, real-time updates, integration with external data sources, and powerful graph analysis to visualize dependencies, track timelines, and simulate disruptions.
For hands-on experience, see the sections on supply chain planning, simulation, analysis, and optimization, or explore interactive live demos such as the Network Flows Demo, Sankey Diagram Demo, Gantt Chart Demo, and Process Mining Demo.
Related content
Got questions about
supply chain management?

Email: hello@yworks.com
Phone: +49 7071 9709050


