yFiles for HTMLDiagramming in the browser
yFiles for HTML is an extensive JavaScript/HTML library that adds diagramming functionality to your web project. It lets you create cutting-edge custom apps while easily integrating with your existing web solutions and dashboards.

We´d love to help you. Reach out and we'll get in touch with you.
Your message has been sent.
Create natural, flowing diagrams directly in the browser
The yFiles diagramming library offers everything needed to easily visualize complex networks and relationships in the browser. Whether starting a new project or enhancing existing data structures, the tools are designed to simplify the process and deliver powerful results. Expert support from core developers ensures a smooth experience, helping to resolve any challenges efficiently.
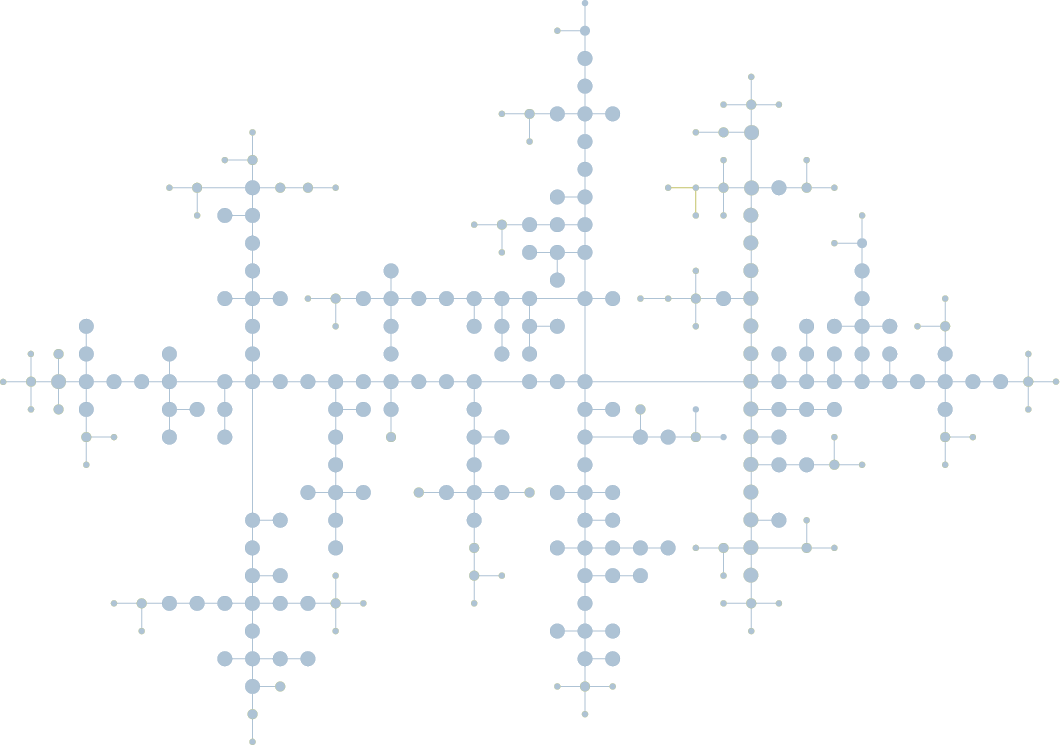
Start transforming complex networks and dynamic relationships into intuitive, interactive diagrams today with the organic layout in yFiles.
Test yFiles free of charge
Technical features
Extensive Developer’s Guide and API documentation, runtime type-checking, debugging tools, plus code completion and quick API lookup in modern IDEs.
A pure JavaScript solution that works seamlessly with Angular, React, Vue.js, and basically any other JavaScript framework.
100% client-side graph drawing and graph editing—no specific server required.
The complete set of type definitions is available for TypeScript.
Supports all modern browsers — from Chrome to Edge, Firefox, and Safari — on desktops, tablets, and phones!
The API supports ECMAScript features like async functions, promises, classes, JS modules, iterators, etc. during development.
Leverages SVG, WebGL, and HTML Canvas to draw diagrams—exclusively, simultaneously, or switched dynamically. It's your choice. Spice up your styling with CSS, animations, and transitions.
Develop with your favorite toolchain!
Use Vite, esbuild, JS modules, Angular CLI, tsc,
plain script loading, and more.
yFiles in action
Interactive demos
Our interactive demos, created with yFiles for HTML, work directly in your browser.
Interactive demosSource-code demos
Explore our demos’ source code on GitHub to kick start or improve your projects.
GitHubPlayground
Try yFiles’ capabilities directly here in the playground.
graph.nodeDefaults.size = [70, 70];
graph.nodeDefaults.style = new ShapeNodeStyle({
  shape: ShapeNodeShape.ELLIPSE,
  cssClass: "node",
});

graph.nodeDefaults.labels.style = new LabelStyle({
  shape: LabelShape.PILL,
  backgroundFill: "white",
  backgroundStroke: "1px solid #6A8293",
  font: "15px poppins",
  textFill: "#6A8293",
});


graph.edgeDefaults.labels.style = new LabelStyle({
  shape: LabelShape.PILL,
  backgroundFill: "#6A8293",
  backgroundStroke: "1px solid white",
  font: "15px poppins",
  textFill: "white",
});
graphComponent.fitGraphBounds()
More information
Working resources
Find helpful resources like Developer’s Guides, API documentation and videos.
Support hubLicense information
Get the right license and accurate pricing information for your specific use case.
Licenses


