Visualize & Optimize Company Structures with Graphs Visualizing relationships and resources for organizational optimization.
To maximize business returns, it's important to ensure all parts of the company work together efficiently. Understanding corporate and organizational structures are essential for success, whether the company is big or small, simple or complex, local or transnational. Visualization is crucial for understanding, because humans process images faster and retain visual information better than text. Without diagramming, complex corporate structures are incomprehensible.
Our diagramming SDK, yFiles, simplifies visualizing company structures. It makes data silos and static charts a thing of the past and lets you map and visualize all possible combinations of intra- and inter-company structures, in order to then analyze and optimize them based on real-time insights. Replacing static charts with flexible, interactive diagrams provides a comprehensive and dynamic view of even the most convoluted organization. Visualization grants insights, exposes inefficiencies, and builds consensus through a common view of complex structures and relationships.

Thank you!
Your message has been sent.
We'll get back to you as soon as possible.
Static map or dynamic system?
Visualizing a company structure is indispensable, but it's only the first step. Consider this diagram of the global mobile telecom ecosystem around 2010.

Source: Visualization of Interfirm Relations In a Converging Mobile Ecosystem.
As a means of communicating the complex interrelations in the ecosystem, this single image is more powerful than pages of text. But beyond that, it's basically useless.
Analyzing, comprehending, and potentially optimizing the ecosystem requires interactive tools that support functions like isolating and magnifying nodes, highlighting orders of relationships, and dynamically transforming the diagram format. By the same token, today's volatile, fast-changing business environment calls for interactive tools to diagram and manage even simple company structures.
Did you know?
Our diagramming SDK can import data from any source – including Excel, JSON files, relational databases, graph databases, and everything you can access programmatically.

Company structures can be complex, with many layers of management, teams, and departments. Visualizing these structures with diagrams can help leaders and employees better understand their roles and responsibilities. yFiles provides powerful tools for creating these diagrams, allowing for customization and flexibility to meet the needs of any organization.— Sebastian Niedworok, Consultant, yWorks
About yFiles: The graph visualization SDK

yFiles is your go-to SDK for crafting advanced graph visualizations, whether you're working with Web, Java, or .NET technologies. Its unmatched flexibility and scalability enable you to convert complex data into clear, actionable visuals, fitting for both enterprise and startup needs.
With yFiles, you're equipped for the future—supporting any data source while maintaining strong data security. Getting started is seamless, thanks to over 300 source-code demos, thorough documentation, and direct access to core developer support. These resources are available even during your free trial.
Backed by 25 years of graph drawing expertise, yFiles is trusted by top companies worldwide for their most critical visualization tasks.
11 reasons why developers choose yFiles, the superior diagramming SDK







Intra- and inter-company relationships
It's not just the big players like General Electric or PETRONAS who have complicated structures. Even relatively small organizations can have complex and interconnected relationships between divisions, business units, subsidiaries, and joint ventures with other companies.
Co-option arrangements, such as joint ventures between competing automobile manufacturers, are also becoming increasingly common. These arrangements allow companies to share risks and costs associated with large-scale projects while also accessing new markets and technologies.
Overall, the growing complexity of intra- and inter-company relationships highlights the importance of effective organizational structures and collaborative partnerships in today's business environment.
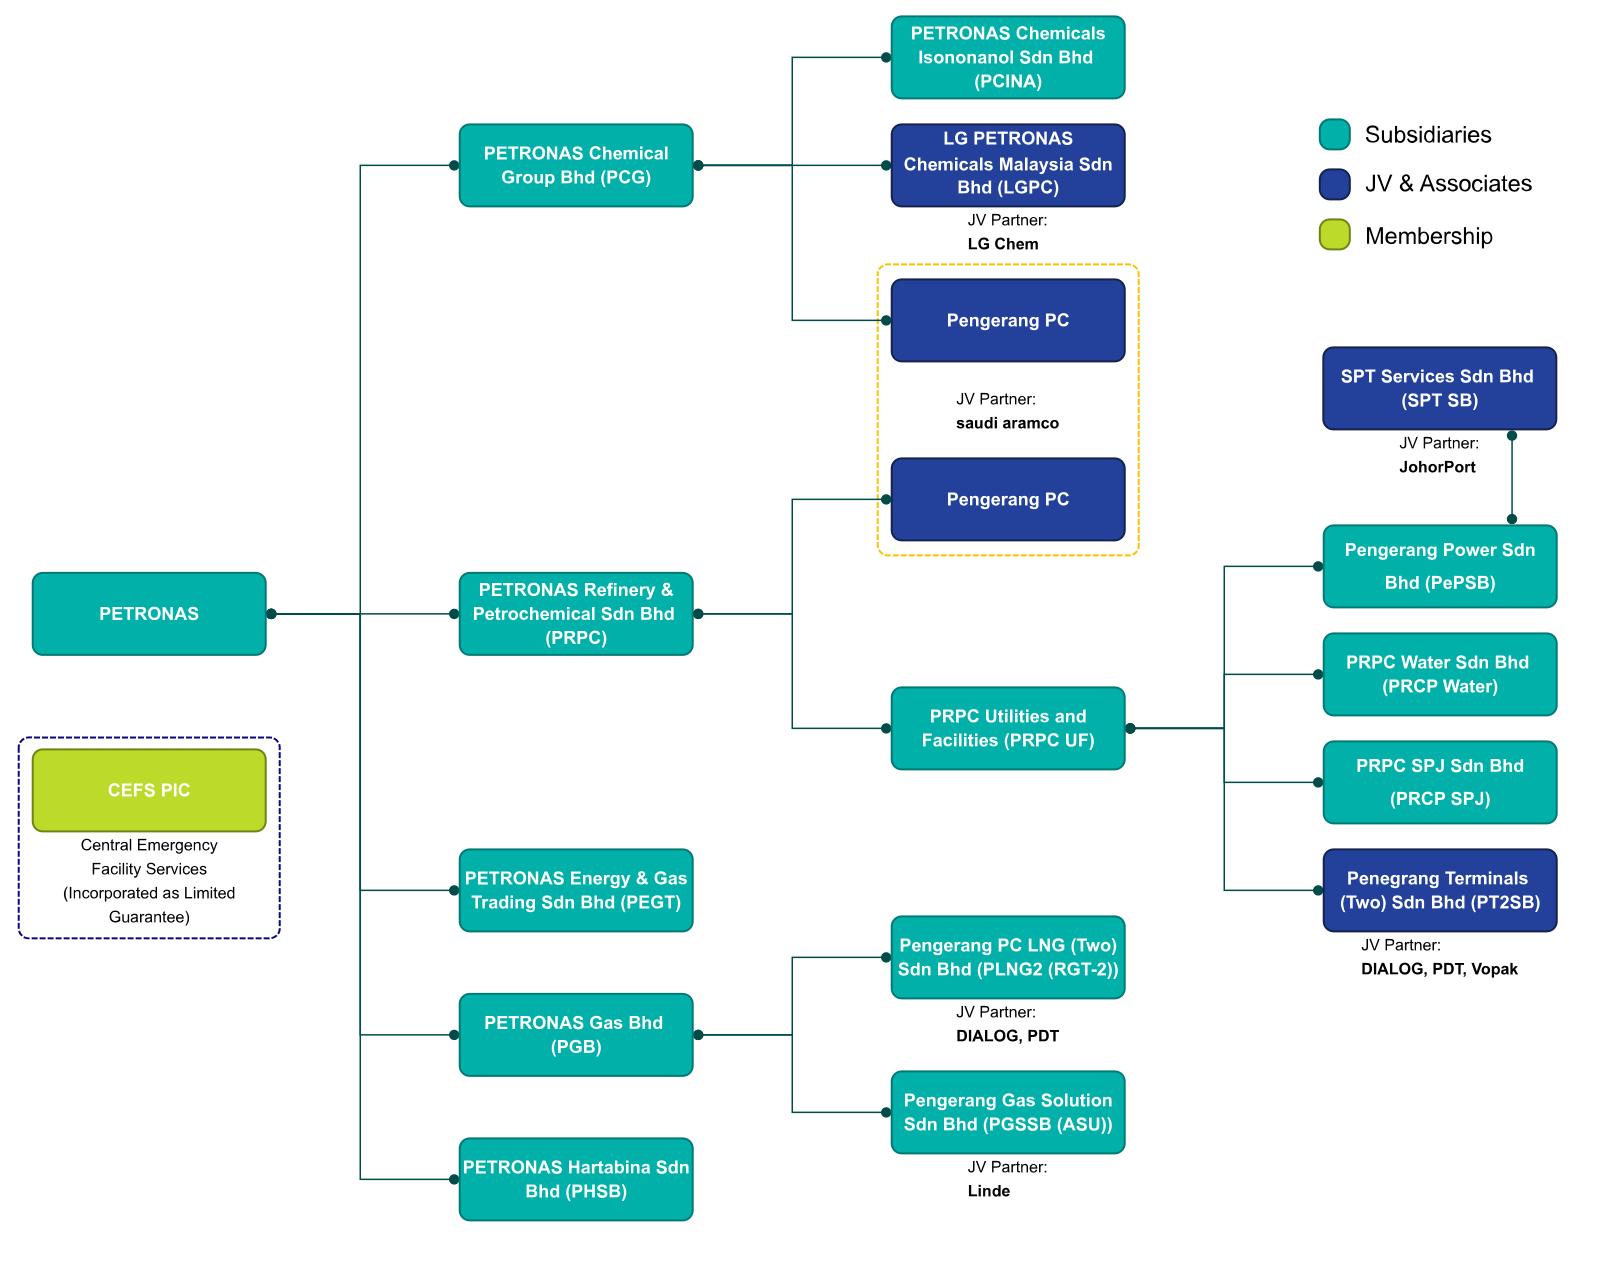
PETRONAS's complex company structure has helped make it a major player in the global oil
and gas industry. (Source:
petronas.com)
>
Open this graph in yEd Live
GE organization structure
Spin-off research
The spin-off strategy being implemented by GE is an example of how company structures can evolve over time to adapt to changing business needs and priorities. By creating a separate business unit for GE Renewable Energy, the company is reorganizing its operations to better align with its strategic focus on this area. This type of restructuring can help companies streamline their operations, reduce costs, and create a more efficient and effective organizational structure. The resulting independent companies can also better pursue their own growth strategies and investments, without being constrained by the broader organizational goals and priorities of a larger entity. Overall, the GE spin-off illustrates how company structures can be adapted to better reflect business realities and maximize value for shareholders.


Includes stakes in AerCap, Baker Hughes and run-off insurance business. Has 19.9% stake in healthcare business. Source: Spin-Off Research
Company ownership
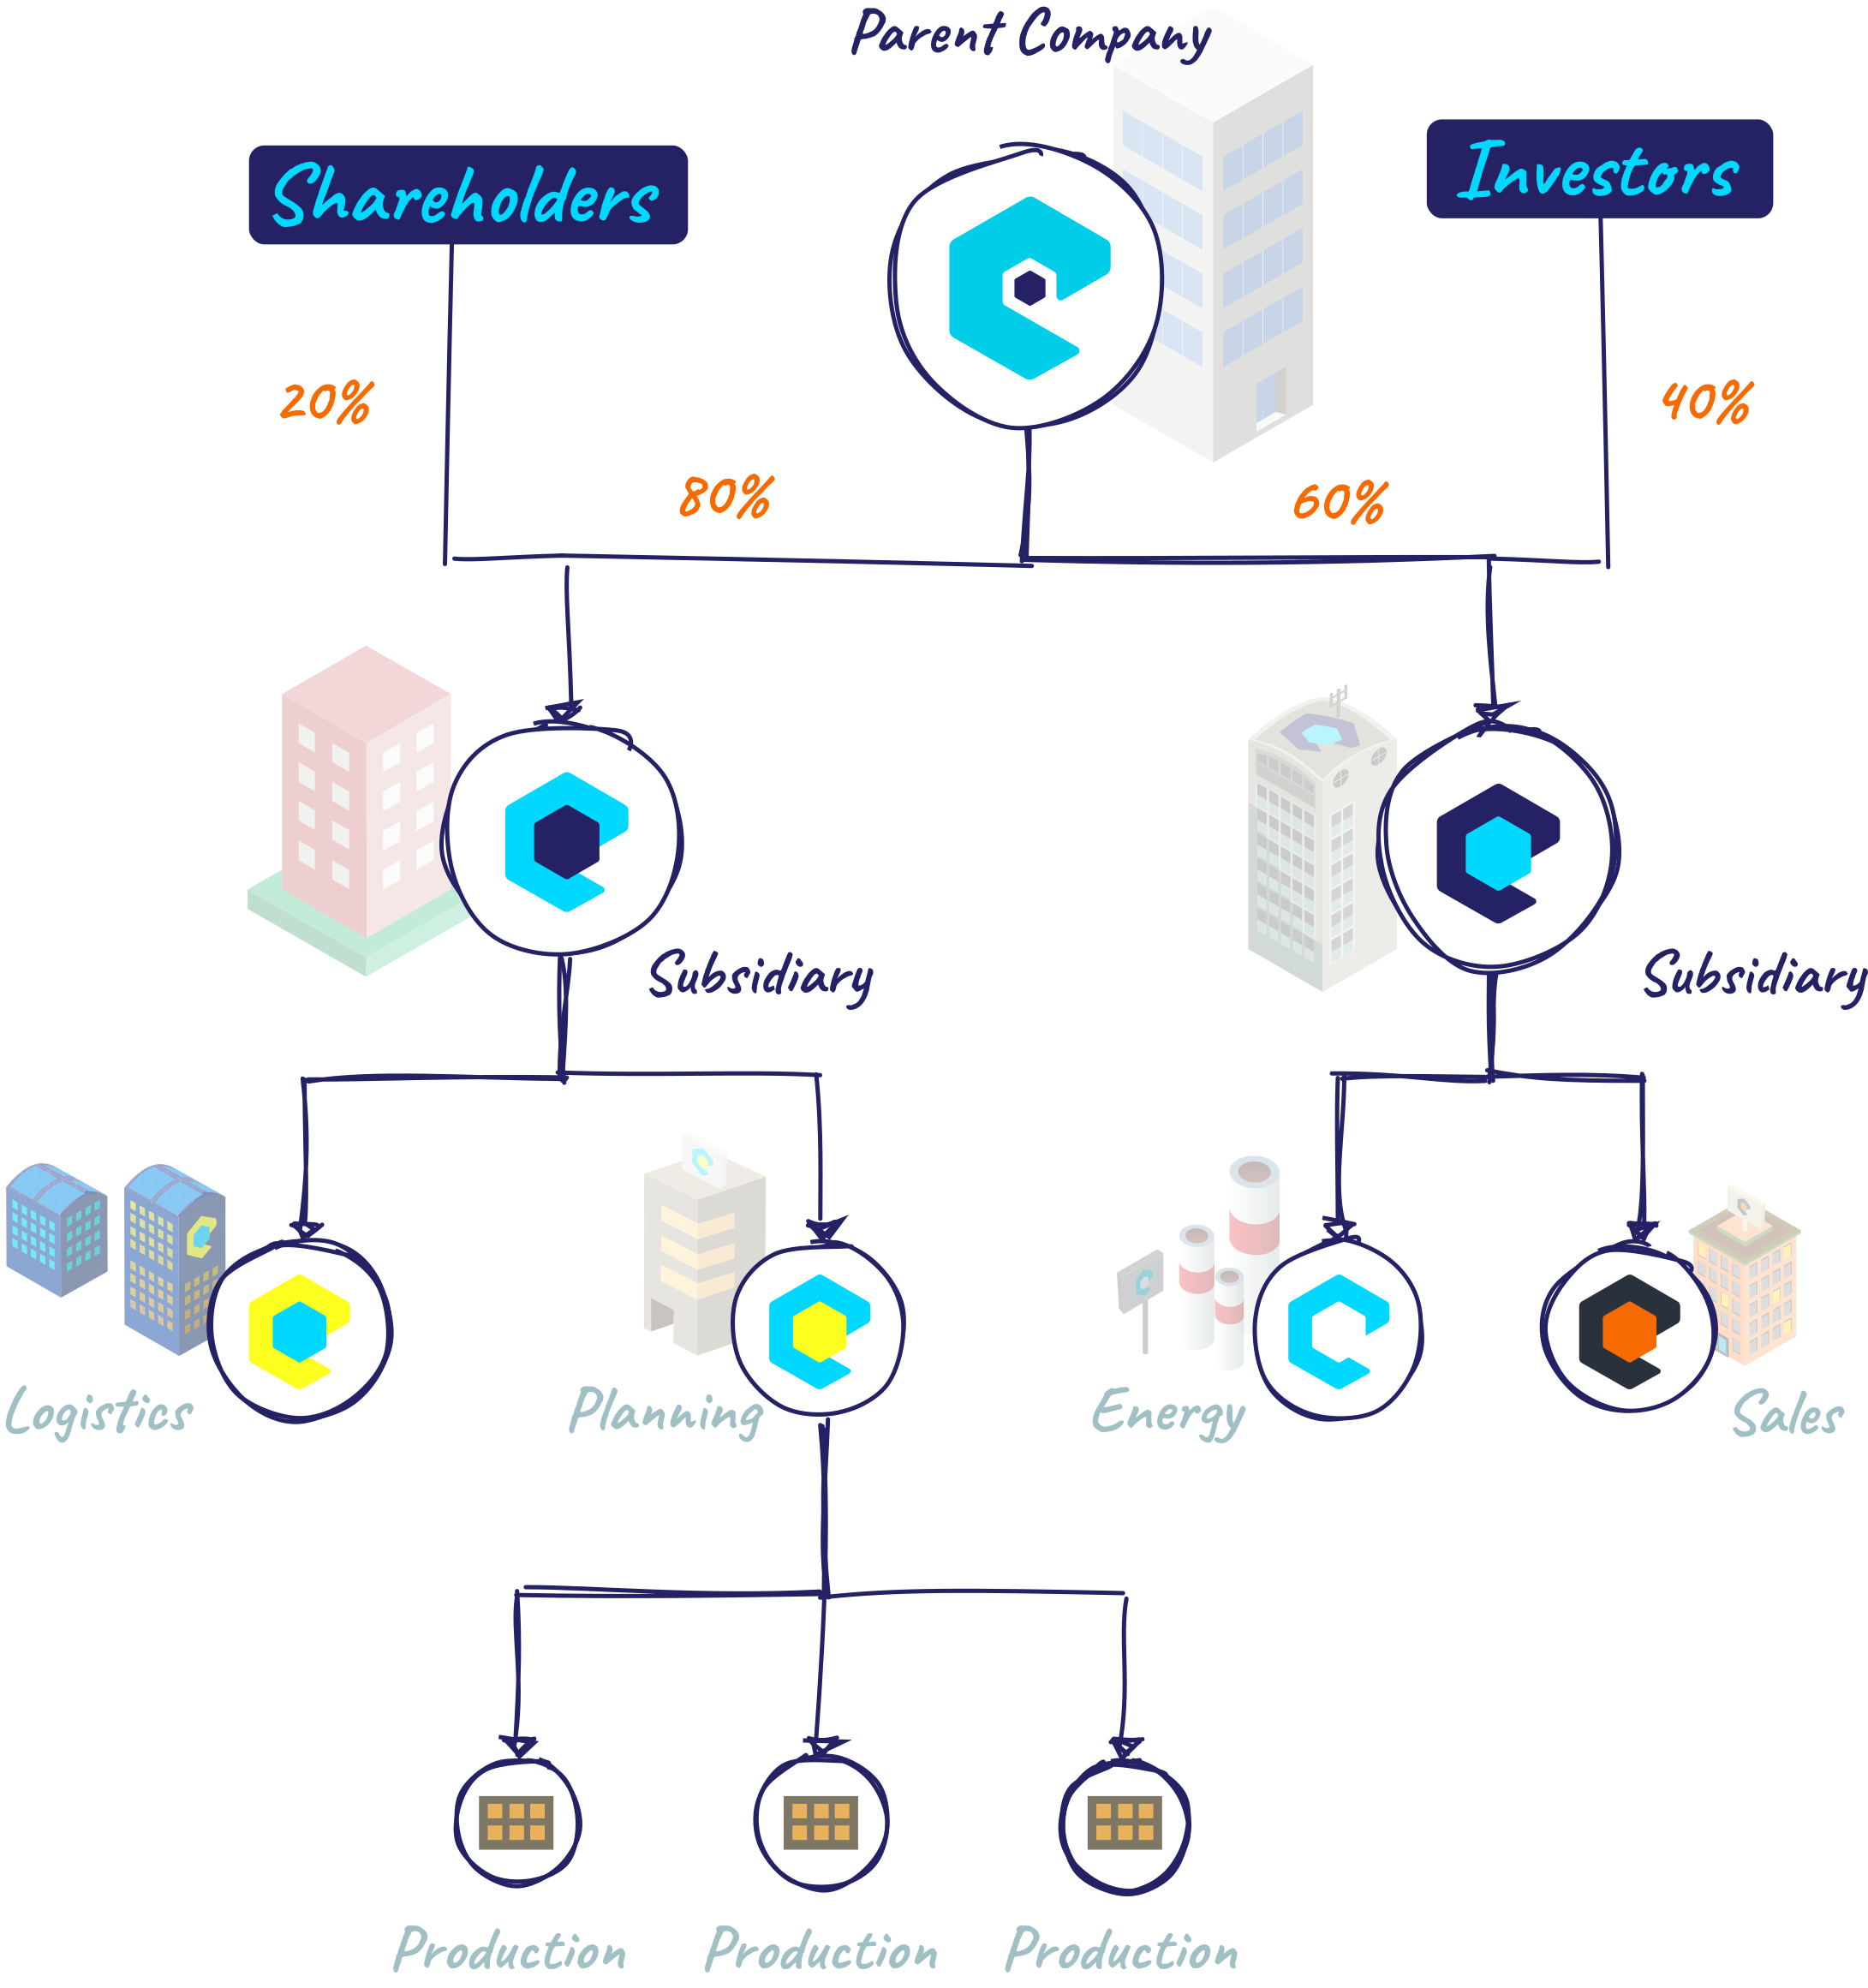
This demo implements an interactive viewer for exploring company ownership. The diagram shows the ownership (shareholders, investors, etc) and the management relationships among business entities. (Source code demo)
yFiles React Company Ownership Component
Our easy-to-use React component, leveraging the powerful yFiles library, enables you to effortlessly integrate dynamic and interactive corporate ownership charts into your applications.
Enrich user engagement and simplify the exploration of intricate company hierarchies.

Fraud and anti-money-laundering detection

2016's "Panama Papers" are the most well-known cache of leaked documents about off-shore accounts. (Others are the "Paradise Papers" in 2017 and the "Pandora Papers" in 2021.) Consisting of some 2.6 terabytes of data, the papers revealed holding companies, shell corporations, and offshore entities used for fraud, tax evasion, money laundering, and evading international sanctions.
Diagramming and visualization was indispensable in revealing relationships and weaving coherent narratives out the hoard of some 11.5 million documents, allowing prosecutors to bring 100s of cases and recover over $1.2 billion in fines and back taxes. (See also this blog post by yWork's CTO Sebastian.)
This demo shows how yFiles for HTML can be used for detecting fraud cases in time-dependent data. (Source code demo)
Personnel organization charts

The org chart is the most familiar and widespread diagram of a company structure. Commonly used to illustrate roles, responsibilities, and lines of reporting, the org chart might also illustrate governance structures (e.g. for a board of directors) or an organization's relationship with clients, partners, and prospects.
yFiles seamlessly supports all types of personnel org charts, such as hierarchical, matrix, horizontal, networked, and team-based. In the new era of hybrid and remote work, dynamic org charts could for example indicate which staff are onsite a given time or use geo-location data to determine who can be quickly deployed to a crisis location.
This demo shows how to create an interactive organization chart from JSON data. The source data is easily converted to a yFiles graph using the class TreeBuilder. The visualization can be made exactly according to the users' needs, and with a level of detail that is helpful for both an overview and specific details. (Source code demo)
And you can do even more with yFiles
Many approaches can be used to design, monitor, and continuously improve processes. yFiles supports all of them – from depicting very large datasets and using visualizations like BPMN diagrams, flowcharts, network diagrams, and data flow diagrams to planning the movement of goods within your company. yFiles also provides many opportunities for analyzing data and generating insights.
Explore the interactive live demos that show the SDK's strengths in supply chain management. The source code of the demos is included in yFiles – even in the free trial!
By the way, yFiles has a special talent: It adapts to any model, method, and scenario. Yes, even the ones we haven't thought of yet. Just get in touch! Together, we'll see how yFiles can meet your diagramming needs.

Recap
Optimize corporate structures with powerful diagramming solutions
Corporate structure visualization displays how companies, divisions, and ownership relate, helping organizations understand and optimize their operations. The page highlights how yFiles enables businesses to move beyond static org charts by creating interactive, data-driven diagrams that reveal complex company relationships and real-time insights.
yFiles is especially effective for visualizing intra- and inter-company links, ownership structures, and for tackling challenges like fraud detection through clear mapping of connections. The SDK easily integrates with business data sources and supports use cases such as advanced org charts, compliance visualization, and investigations of company networks.
Developers can embed yFiles diagrams or leverage ready-to-use React components for flexible integration. Related demos and solutions explore further applications like supply chain analysis, making yFiles a versatile choice for any corporate structure visualization need.
Related content
Choose your next steps
Get connected
Connect with our Customer Success Team regarding your ideas or projects.

Download yFiles
Try yFiles free of charge.