Explore the Craft of Graph VisualizationIn-depth webinar series
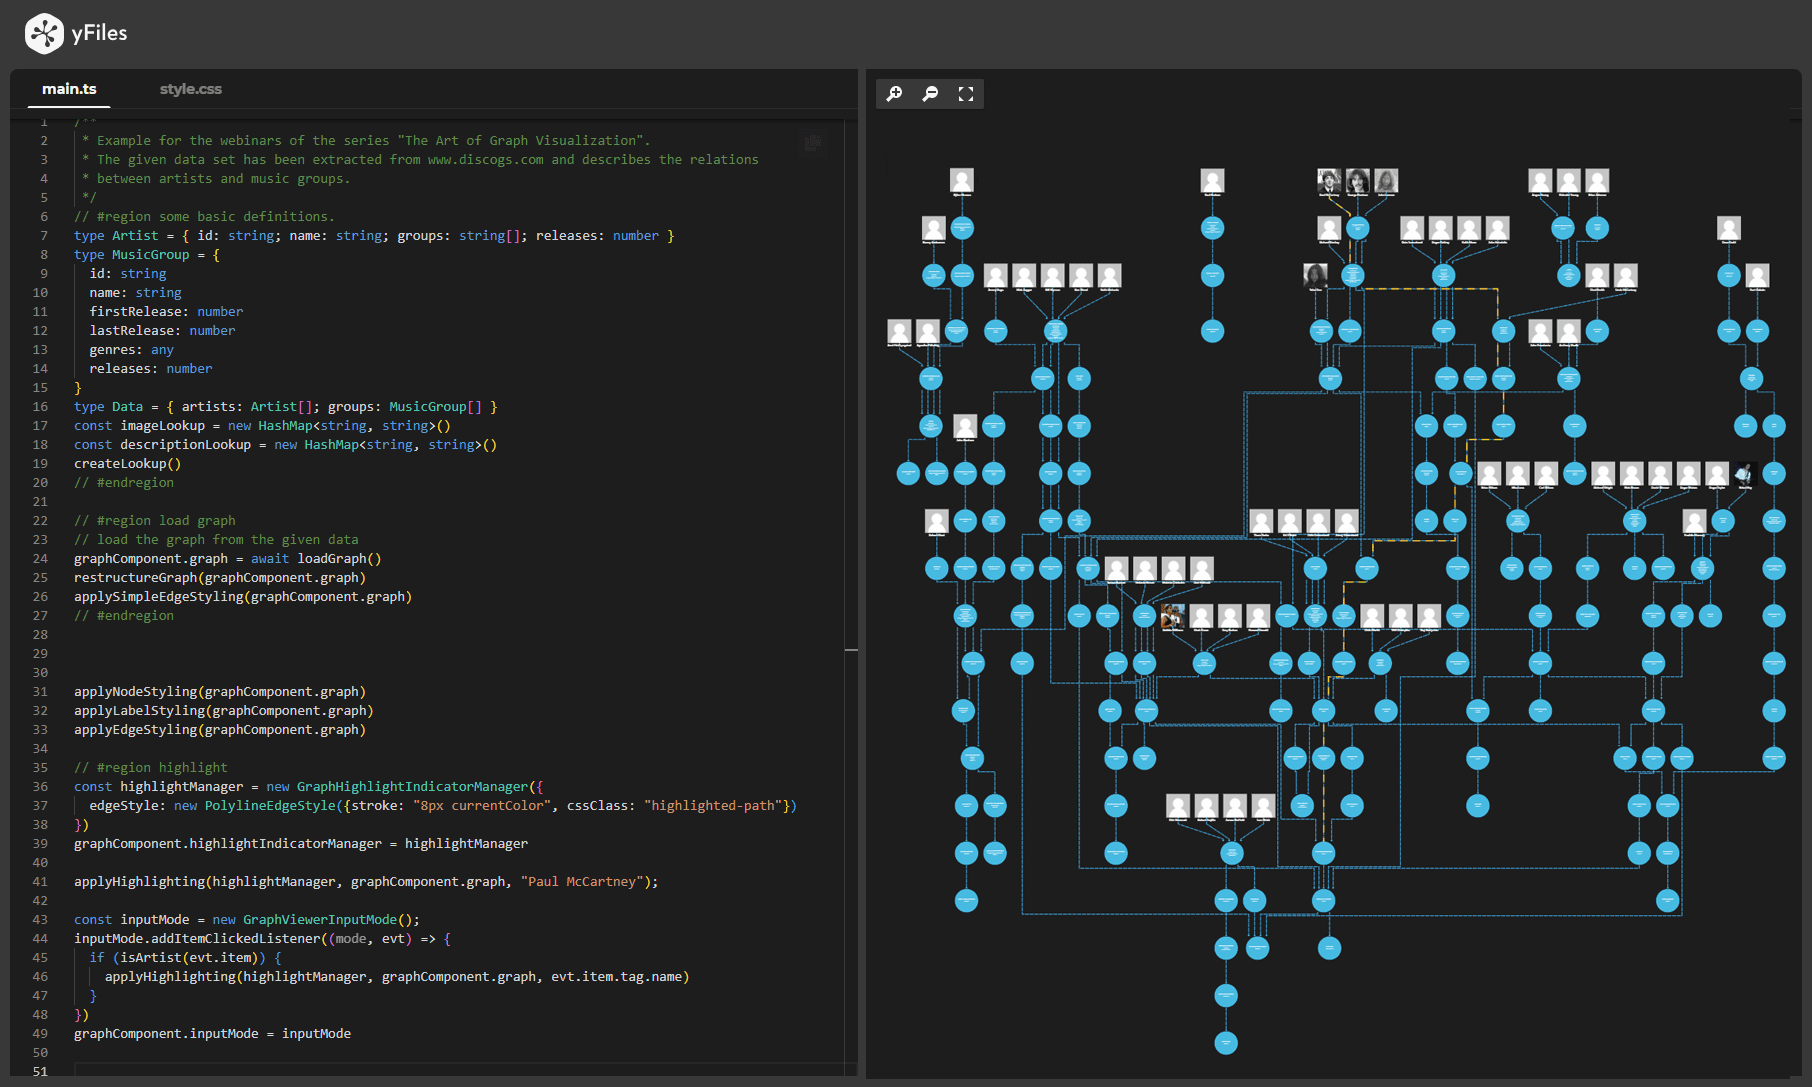
"The Art of Graph Visualization" is a webinar series focused on essential techniques and strategies for creating effective graph visualizations. Presented by Dr. Benjamin Niedermann, a member of the yWorks layout team, the series offers practical insights into designing visually clear and data-driven network visualizations. It caters to a wide audience, including graph beginners, data visualization experts, non-developers, and experienced developers, all looking to enhance their graph visualization skills.
Explore the episodes of "The Art of Graph Visualization"
Each episode in this series delves into key visualization techniques and strategies, offering clear explanations and practical examples. Below, you will find a list of all episodes in the series. Click on any episode to learn more about the specific visualization methods discussed in that session.


