yFiles for HTML Version 3The JavaScript Network Visualization SDK
yFiles for HTML version 3 delivers major improvements that streamline your workflow, enhance your applications, and unlock new possibilities in graph visualization.
Featuring an updated API, seamless SVG and WebGL rendering, and advanced layout features, this release makes development more efficient and intuitive. Whether you’re building a new application or upgrading an existing one, yFiles for HTML 3 offers greater flexibility and precision.
Get started today and take advantage of the most powerful JavaScript toolkit for graph and network visualization in modern web applications.


We´d love to help you. Reach out and we'll get in touch with you.
Your message has been sent.
About yFiles for HTML Version 3
yFiles for HTML 3 introduces a comprehensive revision of many parts of the API. Unlike previous major releases, where we prioritized backward compatibility, this version removes technical debt to provide a more intuitive, consistent, and streamlined experience. The result is a more modern and efficient API that simplifies development.
We focused on areas of the library that were previously complex or difficult to configure. However, core elements like the graph model, GraphComponent, and user interaction have only been selectively adjusted to maintain familiarity.
The improved API not only makes it easier for new customers to integrate yFiles into their projects, but also accelerates the implementation of new requirements in existing applications.
With this release, all planned API changes have been finalized, all demos have been migrated, and the documentation has been fully updated. A migration tool is available to support developers transitioning from previous versions.
Recorded WebinarWhat's new in yFiles for HTML version 3?

You'll get a comprehensive overview of what's changed with this major milestone and explore the exciting new features that have been added. Sebastian will walk you through the updates our team has implemented over the past 15 months and explain why and where the API has evolved.
Revised and streamlined APIs
We have thoroughly revised features like, e.g. folding, the layout graph, and advanced layout configurations. In addition, we have gone through all parts of the library to reduce the overall size and complexity. We removed classes for which there were already better replacements, which had very little use, or were difficult to use properly. In addition, many features are now simpler to use as we have improved built-in default behavior and settings.
The following are examples of revised features.
Custom visualizations in the Graph Component
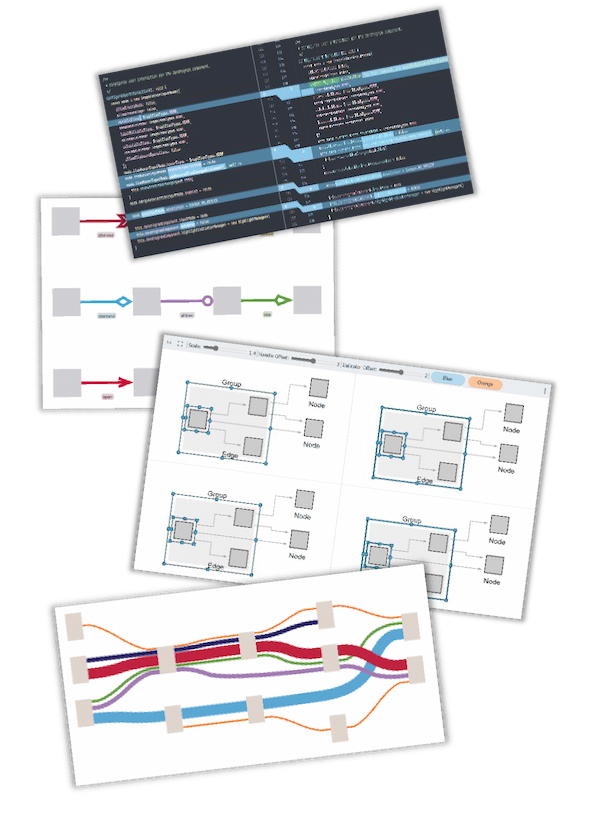
The visualization of handles, selections, grids, and any other elements that are not graph items, now uses a uniform and simplified interface. This means that more advanced configurations of the display of these elements can all be implemented in a similar way. However, many adjustments to the display can already be achieved directly using CSS.
Easier configuration of layout algorithms
The LayoutData concept from the view part is now also available for the layout part, making it much simpler to configure the layout algorithms there. Major refactorings and simplifications were done to reduce the complexity of the API, including things like the labeling API and handling advanced constraints like port candidates.
Aligned graph models for layout and view parts
Due to the API refactoring, the LayoutGraph class and related types are now more similar to the IGraph interface and therefore much easier to use.
Reworked folding API
The new API for Folding makes it easier to adapt this feature to specific requirements, provides more configuration options, and removes inconsistencies in behavior.
New Major Features
User interface modernization
The user interface has been completely modernized in this release. The default styling now features a contemporary design language across all elements - from scrollbars and context menus to tooltips. The interface can be easily customized to match your corporate design using CSS variables.
We have also reimagined the keyboard shortcuts and gesture controls, striking an optimal balance between familiar graphical application conventions and diagram-specific editing needs.
Input support has been expanded beyond mouse, keyboard, and multi-touch to include stylus and modern touchpad interactions, all working seamlessly out of the box.
Tight integration of WebGL rendering mode
In version 3, the SVG and WebGL rendering modes can use the same styles for visualizing the graph items (nodes, edges, etc.) which makes switching between these modes effortless. You can switch render modes at any time if the need arises, for example to display very large datasets in one view.


Context menu included
The library now includes a fully customizable context menu. You have complete control over the menu elements and can customize all UI elements to your liking. Of course, it's also still possible to use the context menu of your favorite UI framework.


Beyond orthogonal snapping
Snapping along horizontal and vertical lines has long been possible in yFiles, but not all diagrams are orthogonal. The improved snapping feature of version 3 has you covered: items can now snap to diagonal lines, lines at arbitrary other angles, and even circles.


Port alignment in Hierarchical Layout
The Hierarchical Layout now allows the ports of edges on the same node to be aligned vertically or horizontally. This enhancement is particularly beneficial for visualizing paths within a graph, as shown below.


More symmetry in Hierarchical Layout
The Hierarchical Layout now supports a more symmetric placement of the nodes that are part of chains or trees. Such a placement usually increases readability and supports highlighting these specific structures.


Significant speed-up of Organic Layout
The OrganicLayout algorithm has undergone significant performance optimization through comprehensive implementation refinements. Layout calculations now execute up to an order of magnitude faster than in the previous version, particularly for large-scale graphs.
This improvement transforms what could previously be a minutes-long process into a matter of seconds, enabling responsive diagramming even with complex networks and extensive datasets.
Substructure style for detected clusters
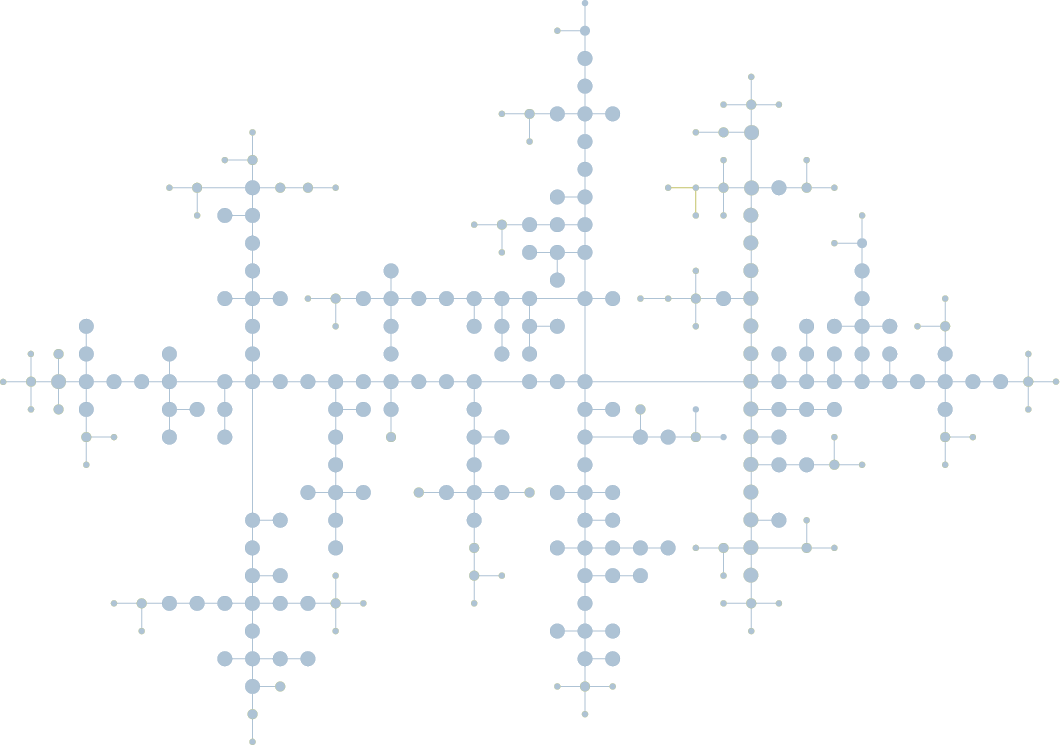
The OrganicLayout now supports selecting specific substructure styles for groups, enabling predefined arrangements of the groups' content, such as placing all children on a single circle or a compact disk. These styles can also be applied to the automatically identified clusters, which helps emphasize such structures better.


Playground
Try yFiles’ capabilities directly here in the playground.
graph.nodeDefaults.size = [70, 70];
graph.nodeDefaults.style = new ShapeNodeStyle({
  shape: ShapeNodeShape.ELLIPSE,
  cssClass: "node",
});

graph.nodeDefaults.labels.style = new LabelStyle({
  shape: LabelShape.PILL,
  backgroundFill: "white",
  backgroundStroke: "1px solid #6A8293",
  font: "15px poppins",
  textFill: "#6A8293",
});


graph.edgeDefaults.labels.style = new LabelStyle({
  shape: LabelShape.PILL,
  backgroundFill: "#6A8293",
  backgroundStroke: "1px solid white",
  font: "15px poppins",
  textFill: "white",
});
graphComponent.fitGraphBounds()
More information
Working resources
Find helpful resources like Developer’s Guides, API documentation and videos.
Support hubLicense information
Get the right license and accurate pricing information for your specific use case.
Licenses


