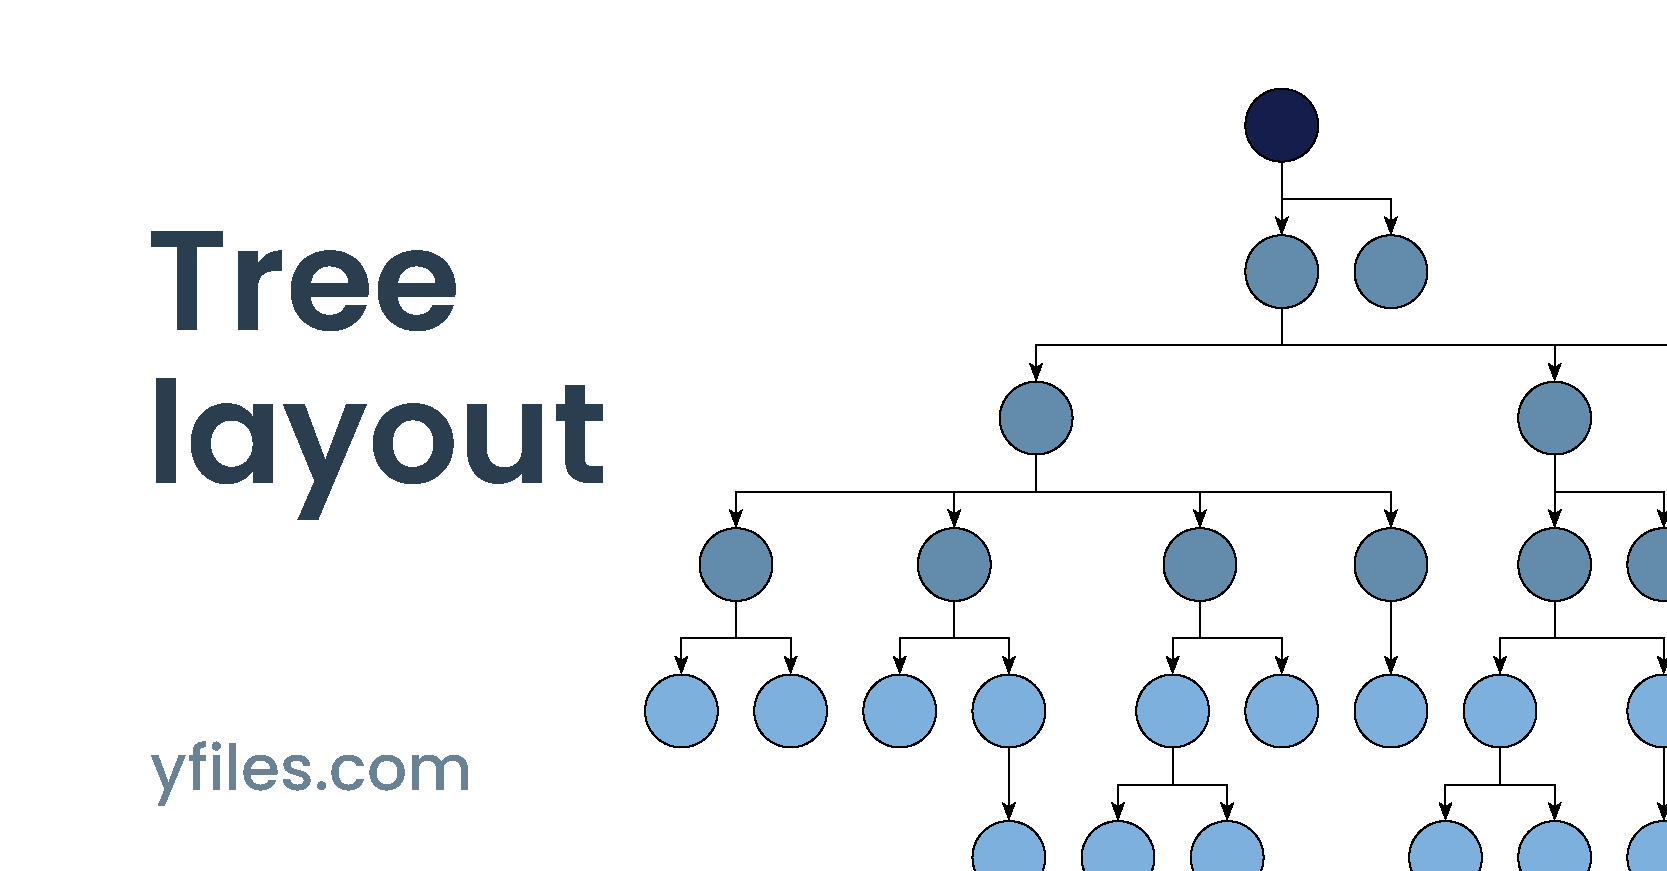
Tree Layout Discover concepts, use cases, and practical customization of the tree layout
The tree layout brings clarity to complex hierarchical data that would otherwise overwhelm users and applications. When you need to visualize organizational structures, decision paths, or any parent-child relationships, this layout engine automatically arranges your data with intelligent spacing and clean connections.
Whether you're building employee directories, product catalogs, or interactive decision tools, it handles the heavy lifting of positioning thousands of nodes while giving you complete control over the visual presentation.
With support for multiple orientations, from traditional top-down charts to space-efficient radial designs, it ensures your hierarchical data tells a clear story rather than creating visual confusion.

What is a tree layout?
The tree layout is fundamentally about bringing order to hierarchical relationships, transforming raw parent-child data into visually intuitive structures that mirror how we naturally think about organization and flow.
Its core purpose lies in making complex hierarchies immediately comprehensible, whether you're navigating a company's reporting structure, exploring decision pathways, or browsing through categorized information.
What sets yFiles tree layout apart is its sophisticated intelligence that goes far beyond basic hierarchical visualization. Unlike simple tree tools that force rigid structures, yFiles gracefully manages complex real-world scenarios, handling multiple root nodes, applying your custom business rules for organizing child elements, and dynamically adjusting spacing to prevent visual chaos as your data grows.

This combination of technical precision and visual flexibility makes yFiles the definitive choice for applications where hierarchical clarity directly impacts user success.
Create your own tree diagram application
Whether you're building organizational charts, file system explorers, taxonomies, or interactive decision trees: yFiles' tree layout arranges your hierarchical data automatically—no manual positioning required.
Our advanced algorithms instantly compute optimal positions for thousands of nodes, creating clear, readable structures with smart spacing and clean connections, even in complex scenarios like forests with multiple roots.
Bring your data to life with interactive features: expand and collapse branches, highlight important paths, and let users explore tree structures intuitively—on the web, on any platform, and in your preferred framework.
Build your first interactive tree graph application today—for free!

Thank you!
Your message has been sent.
We'll get back to you as soon as possible.

Use cases Visualizing complex hierarchies
Organizational charts and workforce planning
With yFiles' tree layout, organizational charts turn complex employee data into clear, interactive visuals, instantly showing reporting lines and company structure. The automatic layout handles even intricate hierarchies and matrix teams, ensuring charts stay clear and actionable for workforce planning, onboarding, and communication.

File systems and directory structures
Tree layout visualization transforms complex, nested file systems into clear, navigable diagrams. By displaying the entire directory hierarchy at once, tree layouts make it easier to understand and manage folder structures, avoid unnecessary drilling down, and quickly locate files.
This approach naturally represents the one-to-many relationships in file systems, helping users navigate even deep or complicated directories efficiently. yFiles enables instant, interactive visualization of directory structures, streamlining navigation and comprehension of complex file systems.

Decision trees and risk modeling
Decision trees and risk modeling are key areas where yFiles excels by turning complex analyses into clear visual structures. Visualizing decision points, outcomes, and probability paths helps stakeholders intuitively trace scenarios and understand how choices impact results.
Tree visualization reveals connections between decisions, enabling strategic teams to compare risks and see how early choices affect later options. This makes probability and risk more understandable and easier to communicate.

Interactive decision systems
Interactive decision systems use yFiles to let users navigate complex choices dynamically. For example, in medical diagnosis, doctors interactively explore symptoms, test results, and treatments, with each choice updating visible options in real time.
yFiles enables this by instantly updating layouts and highlighting relevant paths, making complex decision trees clear and focused. This is especially useful in scenarios where early choices impact later options, such as insurance claims or loan approvals.

Family trees and genealogy applications
Genealogical trees are a natural fit for tree visualization. With yFiles, complex family histories become interactive, easy-to-navigate maps. Users can explore generations, follow specific branches, and maintain context of the full family structure.
yFiles supports complex relationships—such as adoptions and multiple marriages—while keeping large family trees readable and interactive, making it simple to trace lineages and uncover ancestral connections.

Dependency trees and system hierarchies
yFiles tree layout can help understanding technical dependencies in large software projects. Unlike package managers that present dependencies as lists, yFiles reveals relationships, such as how libraries branch into modules and where conflicts may occur.
Its interactive features allow developers to explore system hierarchies and understand how changes affect the overall architecture, making it especially useful during refactoring or dependency updates.

Mindmaps and visual brainstorming
Mindmaps help organize complex ideas by branching topics outward from a central concept. With yFiles' tree layout, mindmaps are easy to create and explore. This makes them ideal for brainstorming, project planning, or organizing information during workshops.
yFiles ensures that even large mindmaps remain clear and visually engaging, with smart spacing and interactive features that let users add, reorganize, or collapse topics on the fly.


Core principles of the tree layout Take control of structure and clarity
The process of applying a tree layout in yFiles generally involves two main stages:
1. Root identification and structure analysis
Tree layout begins with root identification and structure analysis, the foundational stage that determines how hierarchical data will be organized and displayed. This process involves detecting the root node, and extracting valid parent-child relationships that form a proper tree structure without cycles.
By default, yFiles handles this analysis automatically and temporarily reduces general graphs to tree structures if required.

2. Node positioning and spacing
The layout algorithm proceeds bottom-up, starting from the leaves. When a node is processed, its children's subtrees have already been laid out and are treated as single shapes.
The algorithm arranges these subtree shapes around the current node according to the desired arrangement style and routes the edges to the children.

Incremental layout (also known as from-sketch mode)
The incremental layout feature in yFiles (referred to as "from-sketch mode" in the API) integrates new or modified nodes and edges into your existing diagram by adapting the layout intelligently. While the positions of unchanged elements are not guaranteed to stay fixed, the algorithm aims to retain as much of the original drawing as possible, helping to preserve context and provide stable, clear visualizations as your graph evolves.

Incremental layout is ideal for applications where changes occur dynamically or in real time, such as editing workflows, expanding trees, or visualizing live data. With yFiles, you can enable this mode to provide seamless, responsive updates as your users interact with the graph.
Concepts recap
| Concept | Meaning |
|---|---|
| Structure organization | Identify root and organize tree hierarchy with proper depth assignment |
| Spacing and positioning | Control layer and subtree spacing with adaptive node positioning |
| Incremental mode | Only new or changed parts of the graph are re-laid out |
Watch the full webinar episode
Watch the full episode below to gain a comprehensive understanding of tree layouts in yFiles. Dr. Benjamin Niedermann walks you through the core concepts and provides practical demonstrations.
Explore more resources:

Watch the full episode below to gain a comprehensive understanding of tree layouts in yFiles. Dr. Benjamin Niedermann walks you through the core concepts and provides practical demonstrations.
Explore more resources:
Interactive tree layout demos
Discover a selection of interactive demos showcasing different tree layout features in yFiles. Explore how various layout options help visualize complex structured data clearly and intuitively.


Step-by-step guide How to create a tree layout with yFiles
Creating a tree graph layout with yFiles takes just a few steps:
1. Create the network from business data
2. Make information visible
3. Improve arrangement
4. Apply different layout options

Interactive tree layout playground
The Playground lets you experiment with yFiles' tree layout interactively. Create, edit, and style graphs, adjust layout parameters, and see results instantly—all in one online IDE. The included sample demonstrates an organization chart, showing how easily you can design and prototype business hierarchies and other structured data with yFiles.
  graph.nodeDefaults.size = [70, 70];
  graph.nodeDefaults.style = new ShapeNodeStyle({
    shape: ShapeNodeShape.ELLIPSE,
    cssClass: "node",
  });

  graph.nodeDefaults.labels.style = new LabelStyle({
    shape: LabelShape.PILL,
    backgroundFill: "white",
    backgroundStroke: "1px solid #6A8293",
    font: "15px poppins",
    textFill: "#6A8293",
  });


  graph.edgeDefaults.labels.style = new LabelStyle({
    shape: LabelShape.PILL,
    backgroundFill: "#6A8293",
    backgroundStroke: "1px solid white",
    font: "15px poppins",
    textFill: "white",
  });
  graphComponent.fitGraphBounds()

Why use yFiles' tree layout? Unique capabilities for tree layouts you won't find in other SDKs.
While many software development kits (SDKs) can generate tree layouts, only yFiles provides these game-changing advantages, like different subtree placers, and incremental layout mode:
Different subtree placers
In practice, subtree placers are especially valuable for tailoring layouts to domain-specific needs. For example:
- Mindmaps or trees with clear separation between "left" and "right" can employ a left-right subtree placer, creating a visually balanced split. (See Figure 1 below)
- When visualizing trees with many leaf nodes, placing the leaves in a left/right arrangement enhances clarity, making wide layouts more compact and readable (see Figure 2 below).

Figure 1: Mindmap with left-right subtree placer.

Figure 2: Tree with left-right subtree placer.
Compact layouts, seen below, are also achieved by combining and automatically selecting suitable subtree placers to optimize for the available space or desired aspect ratio.
Compact layouts
The layout allows specifying a desired aspect ratio, so you can adapt the shape of the result to your available space—e.g., wide layouts versus tall layouts. Here is the same structure with two different aspect ratios:

Wide aspect.

Tall aspect.
For compact layouts the yFiles tree layout uses the CompactSubtreePlacer . The Organization Chart demo illustrates this.
Incremental layout mode
Before and after local change of the incremental tree layout.
Non-trees

Multi-parent structures

Labeling

Groups

Ideal for visualizing hierarchical data, organizational charts, or ancestry structures, yFiles' tree layout delivers clear parent-child relationships and easily interpretable diagrams—even as your data grows in size and complexity.
All of this runs efficiently on yFiles' robust engine, capable of handling thousands of nodes with smooth, real-time layout updates and animations.
Frequently Asked Questions
What makes the yFiles tree layout better than other tree visualization tools?
yFiles Tree Layout stands out with its intelligent positioning algorithms that automatically handle complex real-world scenarios like multiple root nodes, dynamic spacing, and incremental layout. Unlike basic tree tools that create rigid structures, yFiles gracefully manages thousands of nodes while maintaining visual clarity and real-time adaptation to user interactions.
How does yFiles handle family trees with complex relationships like marriages and adoptions?
The yFiles tree layout brilliantly manages complex genealogical relationships beyond simple parent-child connections. It visualizes marriages between family lines, adoptions, multiple spouse relationships, and maintains readable layouts even for family trees spanning centuries. Interactive features let users zoom from broad family overviews to specific relationships while keeping the larger family context visible.
How effective is yFiles for creating decision trees and risk assessment models?
yFiles excels at decision tree visualization by transforming complex analytical processes into clear visual narratives. Risk assessment becomes intuitive when decision points, outcomes, and probability branches are laid out as navigable structures. Teams can explore multiple scenarios simultaneously, trace decision paths visually, and communicate strategic choices effectively to stakeholders.
Does yFiles work on mobile devices and tablets?
yFiles Tree Layout is fully responsive and optimized for mobile and tablet interactions. Touch gestures for pan, zoom, expand/collapse, and navigation work intuitively on all devices. The adaptive layout automatically adjusts spacing and controls for touch interfaces while maintaining the same powerful visualization capabilities across desktop and mobile platforms.
Can I customize the visual appearance and styling of my tree layouts?
yFiles offers extensive customization options for visual appearance, from node shapes and colors to edge styles and animations. You can apply custom themes, conditional styling based on data properties, and create branded visualizations that match your application's design language. The framework supports CSS styling, custom rendering, and dynamic visual updates based on user interactions.
Recap
Tree layout
Tree layout is a fundamental technique in graph visualization for transforming complex hierarchical data into clear, navigable structures. By organizing parent-child or ancestor-descendant relationships in an intuitive branching pattern, tree layout is essential for applications such as organization charts, decision trees, file system explorers, product taxonomies, and technical dependency diagrams.
The yFiles SDK stands out for its advanced, highly configurable tree layout engine that automatically arranges thousands of nodes into visually accessible hierarchies. Supporting classic top-down, left-to-right—as detailed in the about tree layout section—yFiles adapts to real-world complexities like multiple roots, uneven branch depths, and interactive operations such as expand/collapse or filtering.
With yFiles, developers can leverage smart spacing, edge routing styles, user-driven exploration, and flexible personalization to build interactive, enterprise-grade diagrams for any domain. Core setup and customization principles are explained in the core principles and step-by-step guide sections, while practical use cases—from family trees to project dependency charts—are illustrated in the use cases section. See the key benefits section for an overview of the unique strengths of yFiles’ tree layout.
Related content
Choose your next steps
Get connected
Connect with our Customer Success Team regarding your ideas or projects.

Download yFiles
Try yFiles free of charge.
