Fraud Detection through VisualizationUsing diagram visualization techniques to identify and highlight fraud schemes in graph and network data
Turn complex fraud investigations into actionable insights with interactive network diagrams. Visualize relationships and spot hidden fraud rings, suspicious transactions, and critical connections instantly. With yFiles, you can transform raw data into clear, meaningful graphs that help you detect, analyze, and respond to fraud schemes faster and more efficiently—no matter the scale or complexity of your data.
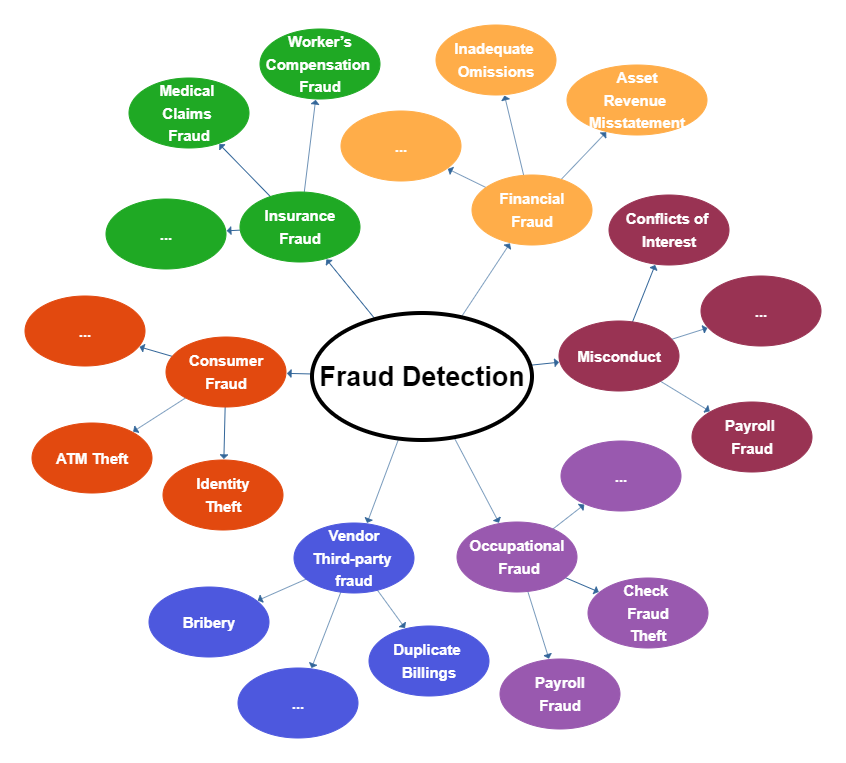
What is fraud detection?
Fraud refers to the abuse of the assets of an organization, company, or person to make a profit. Depending on the relation of the fraudster with the company, fraud is either called internal or external. Internal fraud refers to the fraud committed by someone inside the company, while external fraud refers to fraud by outsiders. The most important fraud schemes include financial fraud, client/consumer fraud, occupational fraud, health-care/insurance fraud, vendor/third-party fraud, or misconduct.

Many companies worldwide become victims of fraudsters even though most of them tend to believe that fraud is something that “could not happen to them”. In general, most fraud cases are not identified immediately, but only after remarkable damage has been caused. Unfortunately, this damage does not limit only on a severe economic loss but also invokes other liability issues towards clients, employees, financial institutions, and many other involved entities. Thus, it is fundamental to be able to identify fraud cases immediately and respond quickly.
Fraud detection refers to all methods and techniques applied for the identification of potential fraud cases, their investigation to determine whether the identified cases are actual fraud cases or not, and the response to them. Unfortunately, there exist a lot of different types of fraud and no unique mechanism that can identify all of them. Thus, auditors have to develop separate strategies to combat each type of fraud.
We´d love to help you. Reach out and we'll get in touch with you.
Your message has been sent.
Advantages of visualizations in fraud detection
The detection of fraud schemes requires an investigation of a vast amount of data that stems from many different anti-fraud systems with varying types of data. The auditors have to combine all the data and use statistical methods to uncover suspicious claims, which is time-consuming and inefficient in most cases.
Visualizations, on the other hand, can enhance the quick identification of relationships and significant structures and the detection of suspicious patterns that may hide in the amount of data. Besides the visual exploration, interaction with the data allows for a deeper understanding of the dependencies within the data changing over time.
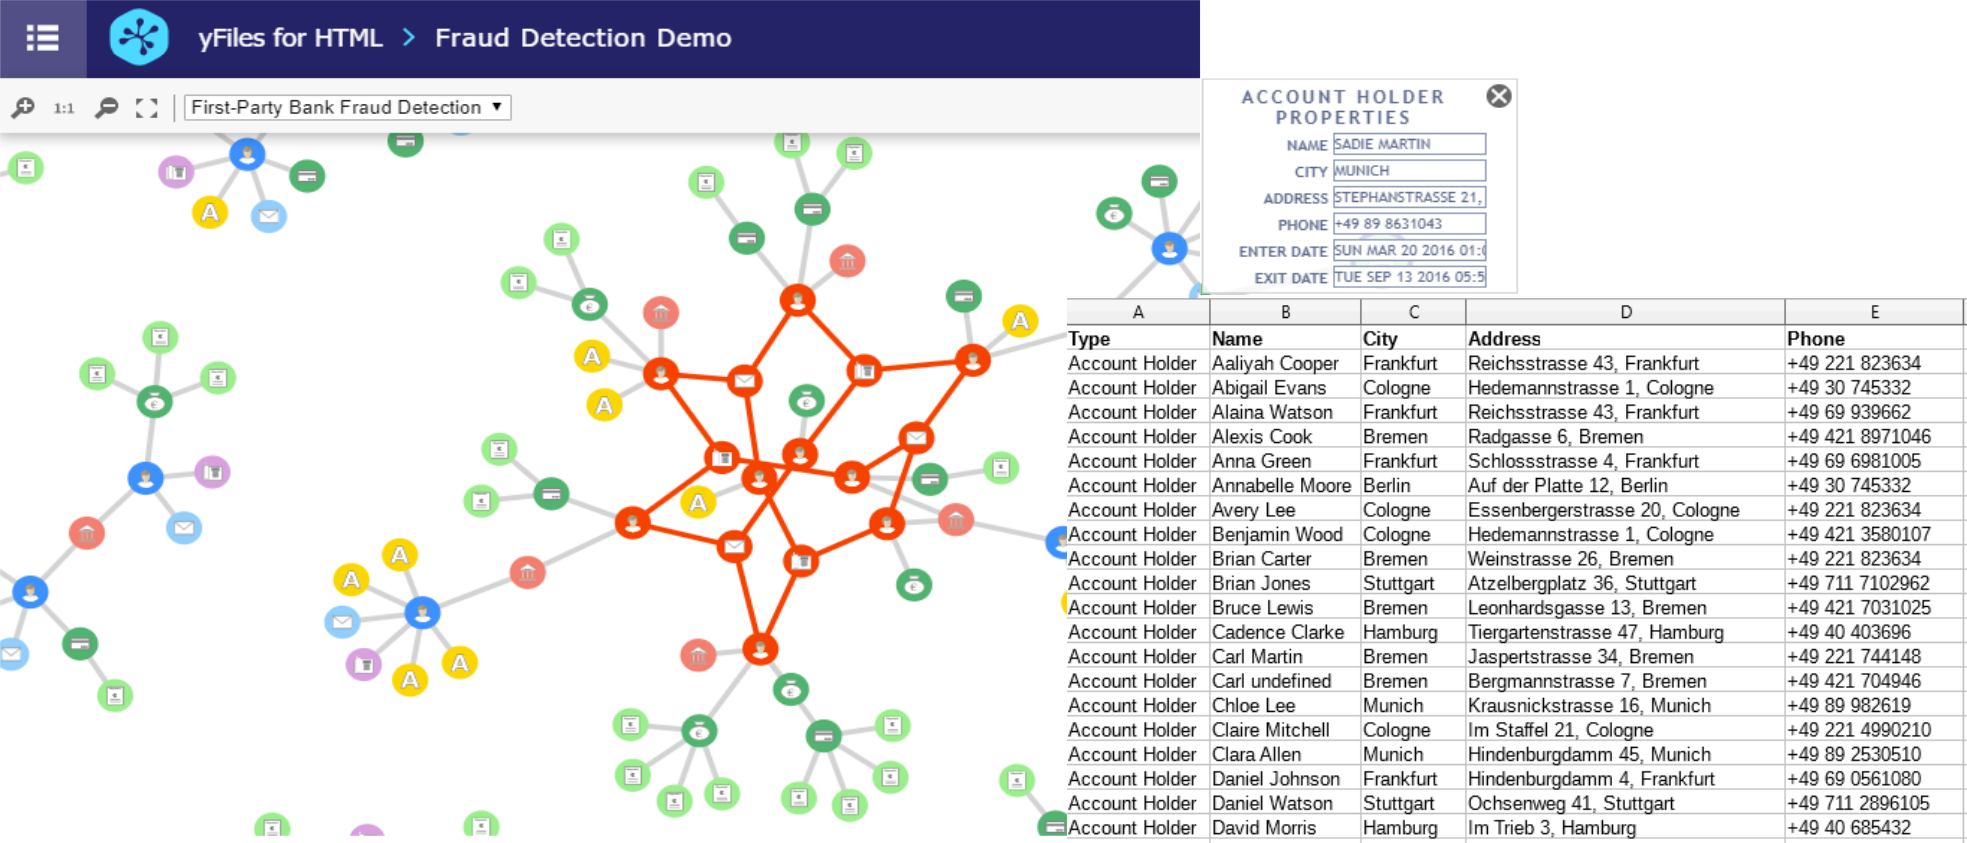
A typical pattern is the so-called fraud ring, i.e., several persons with specific properties that are involved in a series of events. For example, for fraud schemes like insurance fraud or first-party bank fraud, auditors look for potential fraud rings. These structures are perceivable in a suitable visual representation like a diagram. Therefore, it is easier to detected fraud cases through visualization rather than when trying to dig into a large number of database raws.
Challenges of visualizations in fraud detection
One of the most challenging tasks when using visualization for fraud detection is the sheer amount of data that is usually obtained by auditing systems. First, the auditor has to retrieve the data from the auditing system.
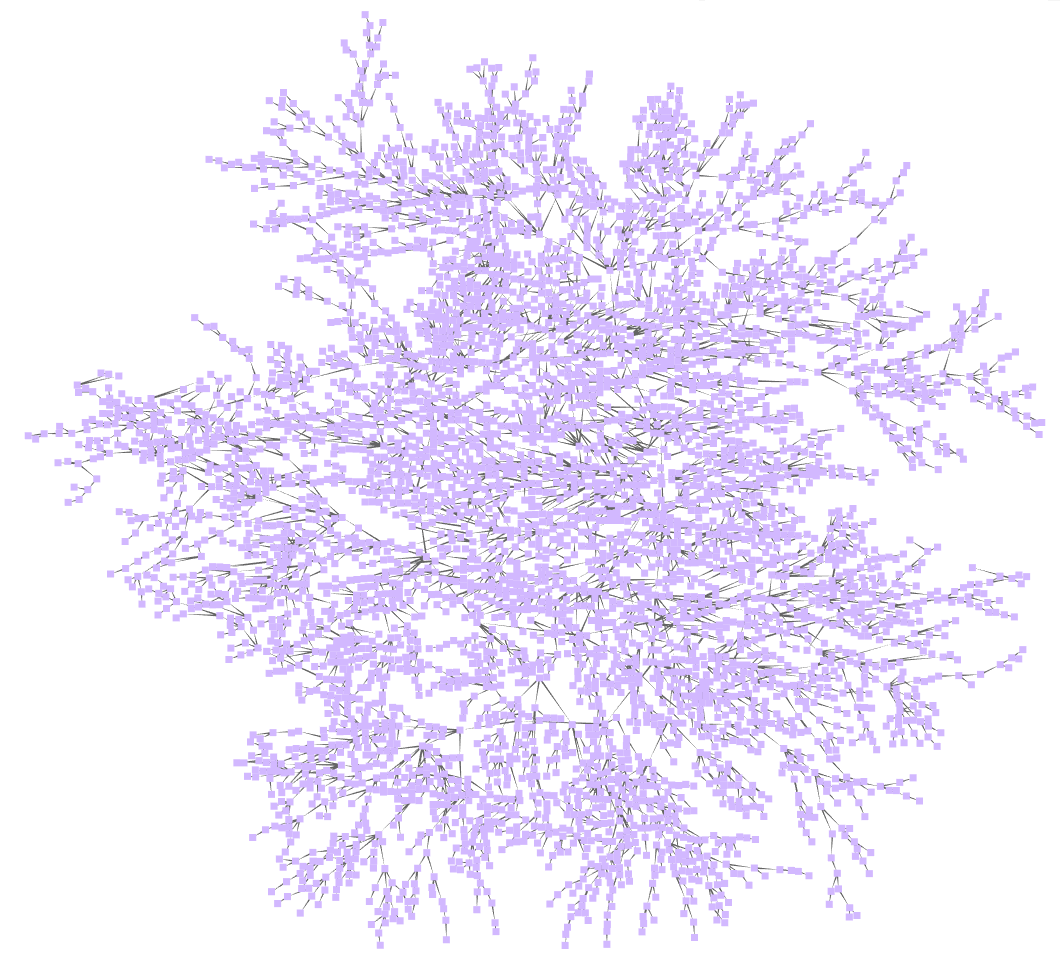
Visualizing such a large amount of data is the next challenge: the data needs a meaningful arrangement to create a human-readable representation. Providing suitable styling should enable users to identify different types of entities and relations.
Furthermore, high performance is essential to allow for interactive exploration of the data utilizing the benefits of graph database visualization.
About yFiles: The graph visualization SDK
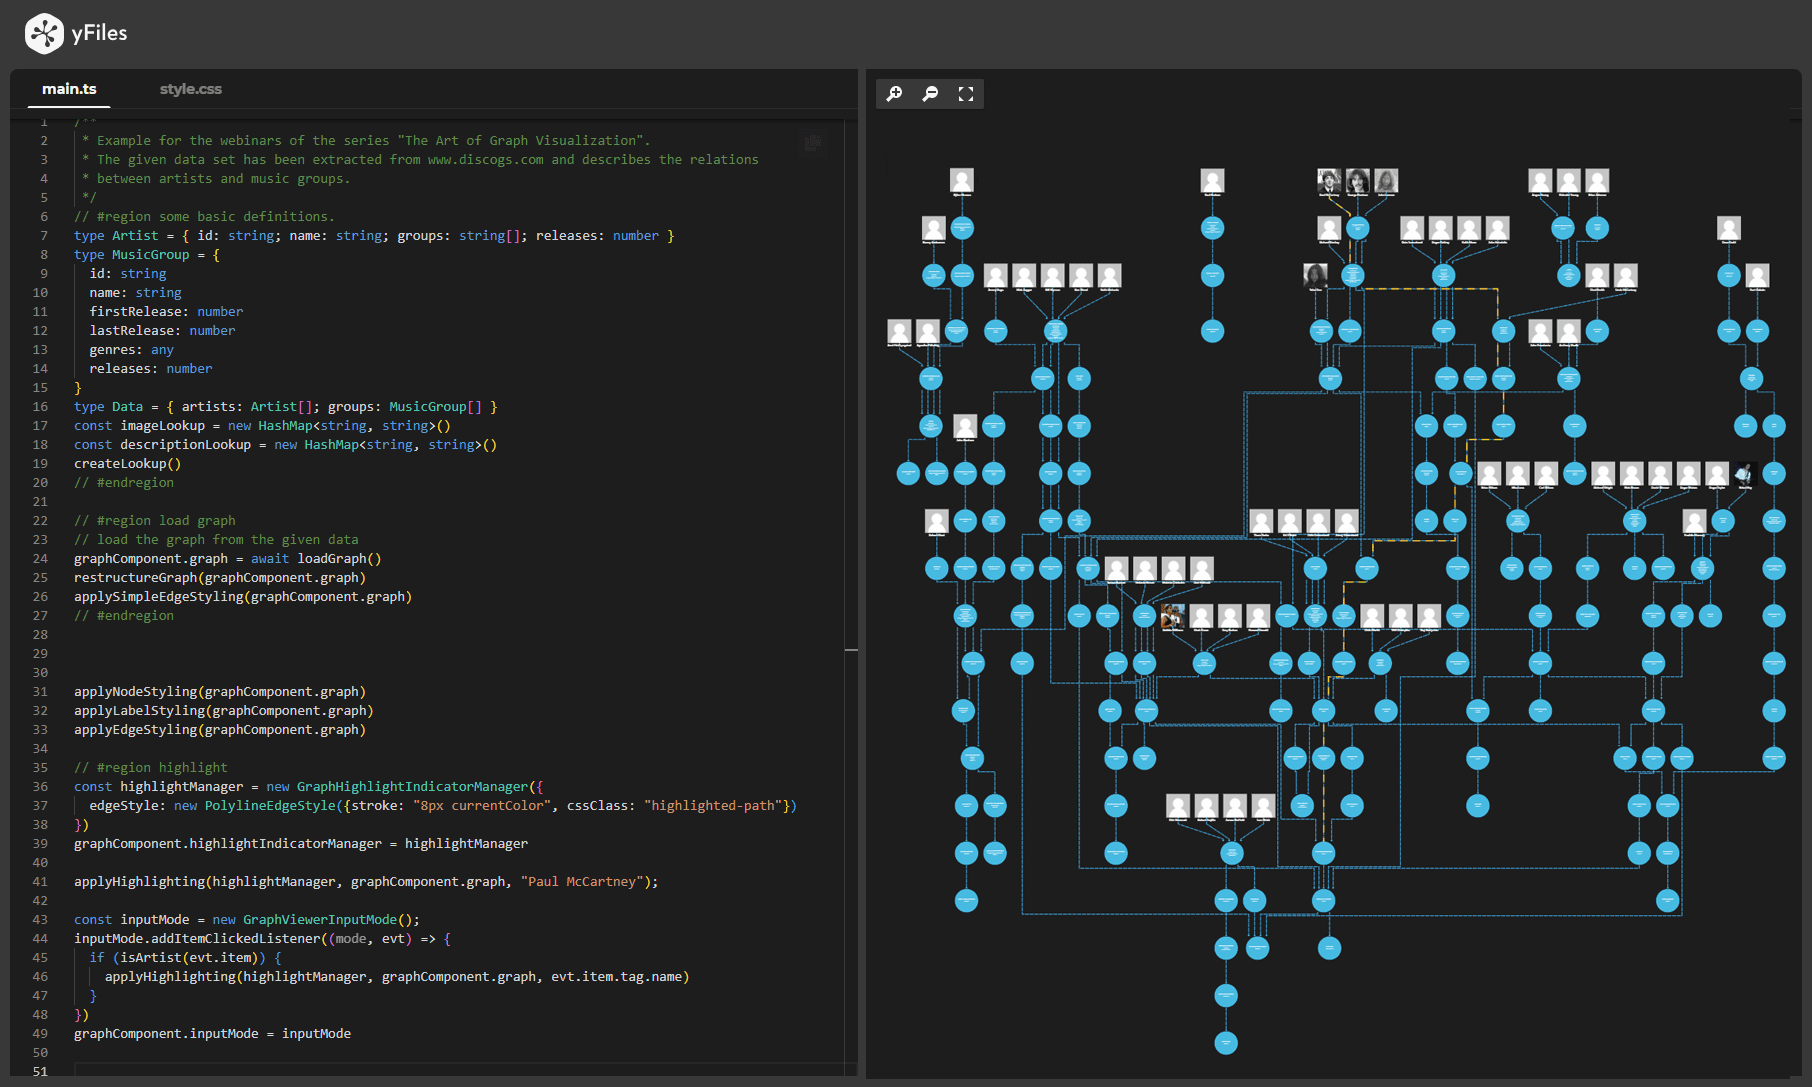
yFiles is your go-to SDK for crafting advanced graph visualizations, whether you're working with Web, Java, or .NET technologies. Its unmatched flexibility and scalability enable you to convert complex data into clear, actionable visuals, fitting for both enterprise and startup needs.
With yFiles, you're equipped for the future—supporting any data source while maintaining strong data security. Getting started is seamless, thanks to over 300 source-code demos, thorough documentation, and direct access to core developer support. These resources are available even during your free trial.
Backed by 25 years of graph drawing expertise, yFiles is trusted by top companies worldwide for their most critical visualization tasks.
Discover yFiles11 reasons why developers choose yFiles, the superior diagramming SDK
How to create visualizations for fraud detection?
Since there exist a lot of different types of fraud schemes, it is clear that there is no unique solution that can detect all of them. Thus, a visualization meant to fight against fraud has to be adaptive to the needs of each auditor.
At first, it must not limit to a specific amount or type of data since the volume of the investigated data grows exponentially and comes from different sources. In some cases, it is also necessary to be able to support and visualize time-dependent data.
A sophisticated visualization should also provide the means for arranging the elements with multiple ways on the screen, i.e., using arrangements that reveal clusters or others that highlight hierarchical structures. Additionally, more sophisticated graph analysis algorithms should be supported for the detection of fraud schemes, e.g., cycle detection, or shortest paths.
Regarding the representation of the elements of the visualization, an auditor should be able to customize the look and feel of the graph elements based on his/her needs and be able to display additional properties of the graph elements. Finally, interaction is one of the essential operations when visualizing fraud data since it allows the auditor to explore its dataset.
Sophisticated visualization of fraud detection using yFiles
A comprehensive visualization solution provides solutions for all the features discussed above should enable the auditors to gain more insight into the stored data. It can be tailored to specific requirements related to element visualization, element arrangement, or interactions.
Building such a visualization from scratch can be a challenging task. However, developers can save a lot of money, time, and workforce by using a software library that provides ready-to-use components for this task.
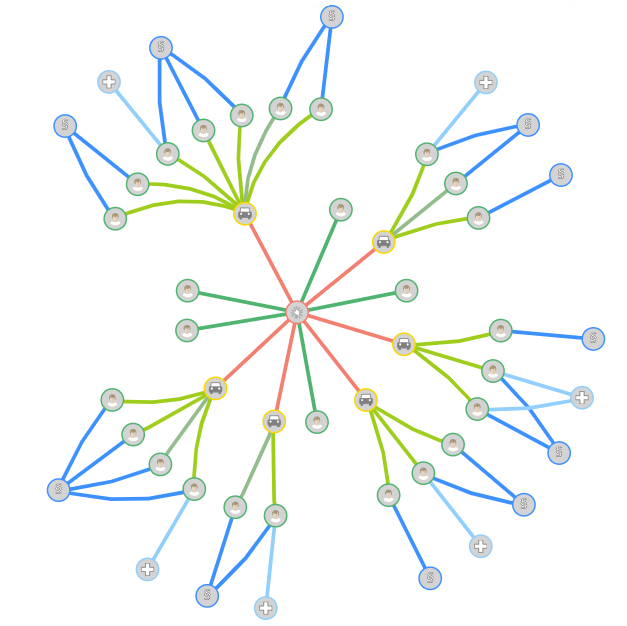
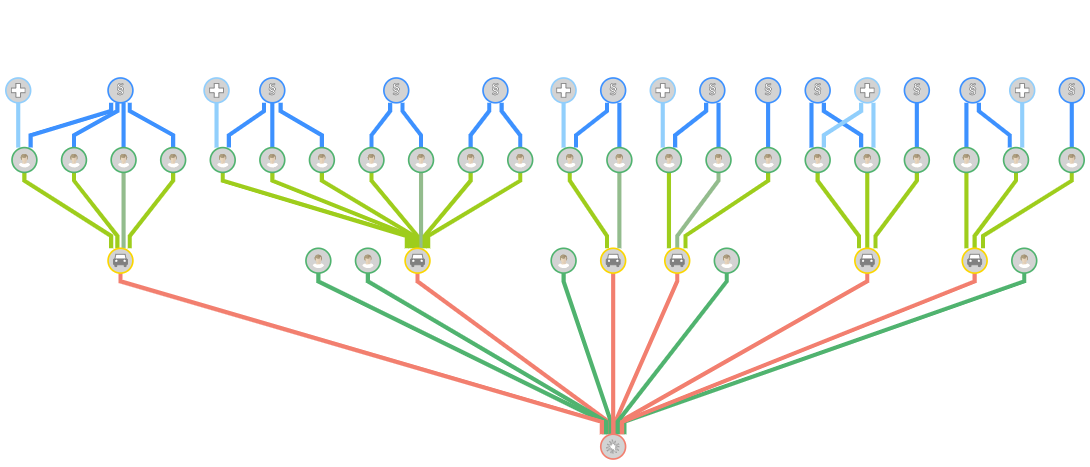
yFiles is a commercial programming library designed explicitly for diagram visualization and is a perfect fit for the challenges of fraud detection. The sophisticated layout algorithms of yFiles can comfortably transform the data in a readable, pleasing, and informative network. The different layout styles enable the user to intuitively identify structural characteristics of the data, such as cycles, connected components, or hierarchies.
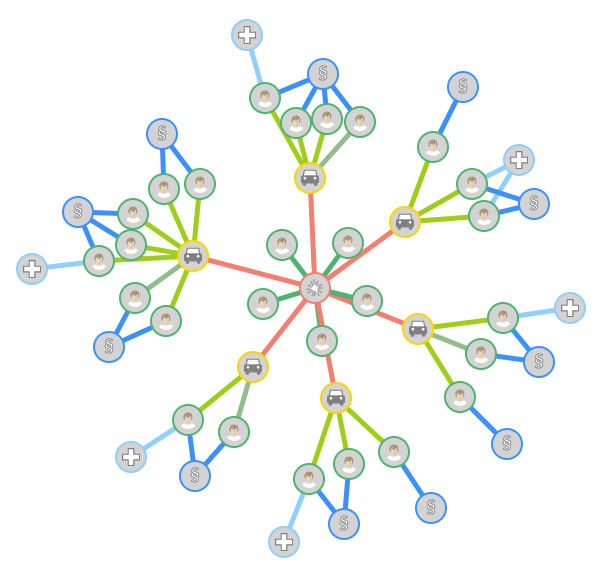
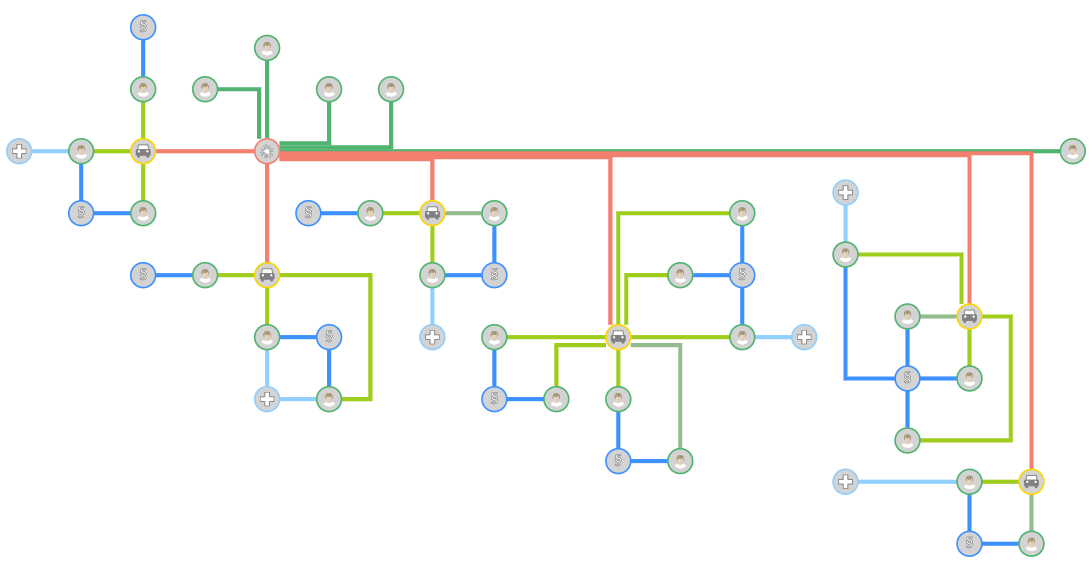

Organic fraud detection diagram

Radial fraud detection diagram

Hierarchical fraud detection diagram

Orthogonal fraud detection diagram
Furthermore, yFiles comes with a multiplicity of graph analysis algorithms, e.g., cycle detection, centrality, clustering, and path algorithms, that can be applied to the data model to add more value to the data. The auditors can also implement custom fraud detection algorithms and integrate them easily with their visualizations.
An interactive application should provide much more functionality than a simple static representation. yFiles delivers a set of interactive features like:
- Filtering reduces the number of displayed entities without any additional database queries.
- Drill down helps to explore specific parts of the data.
- Interactive modification of the graph using the mouse, the keyboard, and touch gestures help to explore the data.
- Animations provide a pleasant user experience and help track structural changes.
- Grouping combines similar or related items to reduce visual complexity.
yFiles comes with predefined styles that render graph elements and offer a broad set of properties to tailor the styling of graph elements for a specific use case or branding. It also supports creating an entirely custom visualization that fits the given data perfectly.
Example and source code
With yFiles, fraud detection diagrams can be realized on all supported platforms. yFiles for HTML comes with a Fraud Detection Sample Application. This example provides a visualization of time-dependent data for the investigation of two different fraud schemes: first-party bank fraud and insurance fraud.
The source code of the Fraud Detection Sample Application is available on the yWorks GitHub repository and part of the yFiles for HTML package.
Recap
Fraud detection through visualization
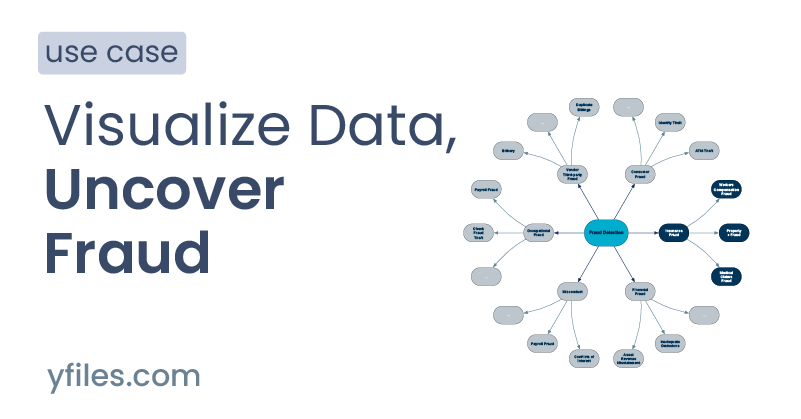
Fraud detection through visualization transforms complex audit data into actionable insights by uncovering suspicious patterns, relationships, and fraud rings within network and graph data. Visual and interactive diagrams help make sense of otherwise overwhelming datasets, supporting rapid identification of fraud schemes and revealing hidden structures such as cycles, unusual clusters, and critical connections described in the sections on visualization advantages and challenges.
The yFiles SDK is especially suitable for developing advanced fraud detection applications, thanks to its rich set of layout algorithms, graph analysis capabilities, and support for interactive features. With yFiles, investigators can build tailored solutions that handle the large volumes and diverse types of data characteristic of fraud analysis, ensuring high performance and engaging, interactive exploration. yFiles supports organic, radial, hierarchical, and orthogonal layouts to adjust the graph for the clearest possible insight into entity relationships, as well as sophisticated algorithms for cycle detection, clustering, centrality, and more, discussed further in visualization with yFiles.
For hands-on experience, explore the Fraud Detection Sample Application or access the source code, or learn more in the database relationships visualization guide.
Related content
Got questions about
the visualization of fraud detection?

Email: hello@yworks.com
Phone: +49 7071 9709050


