Visualizing First-party Bank FraudLearn about fraud detection and how diagrams help to uncover fraud cases
Each year, first-party bank fraud causes billions of dollars in losses worldwide. These schemes not only affect financial institutions but also impact customers and the broader economy, undermining trust and increasing costs related to fraud detection and prevention.
Detecting first-party fraud is challenging since fraudsters often appear as trustworthy clients—until they suddenly stop payments. Graph visualizations help reveal hidden links and suspicious patterns in financial data. This page explains how yFiles equips auditors and developers with powerful, interactive tools to detect and analyze fraud schemes effectively.

What is fraud detection?
Fraud refers to the abuse of the assets of an organization, company, or person to make a profit. Many companies worldwide become victims of fraudsters even though most of them tend to believe that fraud is something that "could not happen to them". In general, most fraud cases are not identified immediately, but only after remarkable damage has been caused. Unfortunately, this damage does not limit only on a severe economic loss but also invokes other liability issues towards clients, employees, financial institutions, and many other involved entities. Thus, it is fundamental to be able to identify fraud cases immediately and respond quickly.
Fraud detection refers to all methods and techniques applied for the identification of potential fraud cases, their investigation to determine whether the identified cases are actual fraud cases or not, and the response to them. Unfortunately, there exist a lot of different types of fraud and no unique mechanism that can identify all of them. Thus, auditors have to develop separate strategies to combat each type of fraud.
What is first-party bank fraud?
In a first-party bank fraud scenario, fraudsters request legal high-value products from financial institutions, i.e., new accounts, checks, loans, or credit cards, with no intention to pay them back. To overcome the financial institutions’ approval stage, which verifies whether the client is trustworthy, they initially behave like regular, reliable clients that pay their debts on time. However, they suddenly stop the payments and disappear with the money, leaving no trace behind since, in most cases, they used fake identities or shared contact information.

Powerful Graph Visualizations with yFiles
yFiles gives you the tools to create clear and scalable graph visualizations for graph databases. With advanced automatic layouts, you can focus on analyzing and optimizing your graph data instead of arranging nodes manually.
Leverage interactive features, animations, and flexible styling to build dynamic graph applications. yFiles seamlessly integrates with web technologies, making it easy to bring data to life in any application.
Start visualizing your database graphs with yFiles today!
Prototype your own graph application
We´d love to help you. Reach out and we'll get in touch with you.
Your message has been sent.
Advantages of visualizations in first-party bank fraud detection
First-party bank fraud cannot be easily spotted in advance since the financial institutions rely on the previous record of “trustworthiness” for each client. Also, fraudsters usually tend to plan the fraud in only a minimal number of institutions so that they are not easily spotted.
Therefore, first-party fraud detection requires an in-depth examination of the client’s profile. The prediction of future intentions is more accurately if the client’s profiles from more institutions are combined.
However, this in-depth examination needs a vast amount of data that stems from many different auditing systems with varying types of data that have to be investigated to detect potential first-party bank fraud cases. One possible solution can be the visualization of this data. The auditors can use visualizations to reveal relationships quickly, detect suspicious patterns, or identify significant structures that hide in this vast amount of data. Besides the visual exploration, interaction with the data allows for a deeper understanding of the dependencies within the data changing over time.
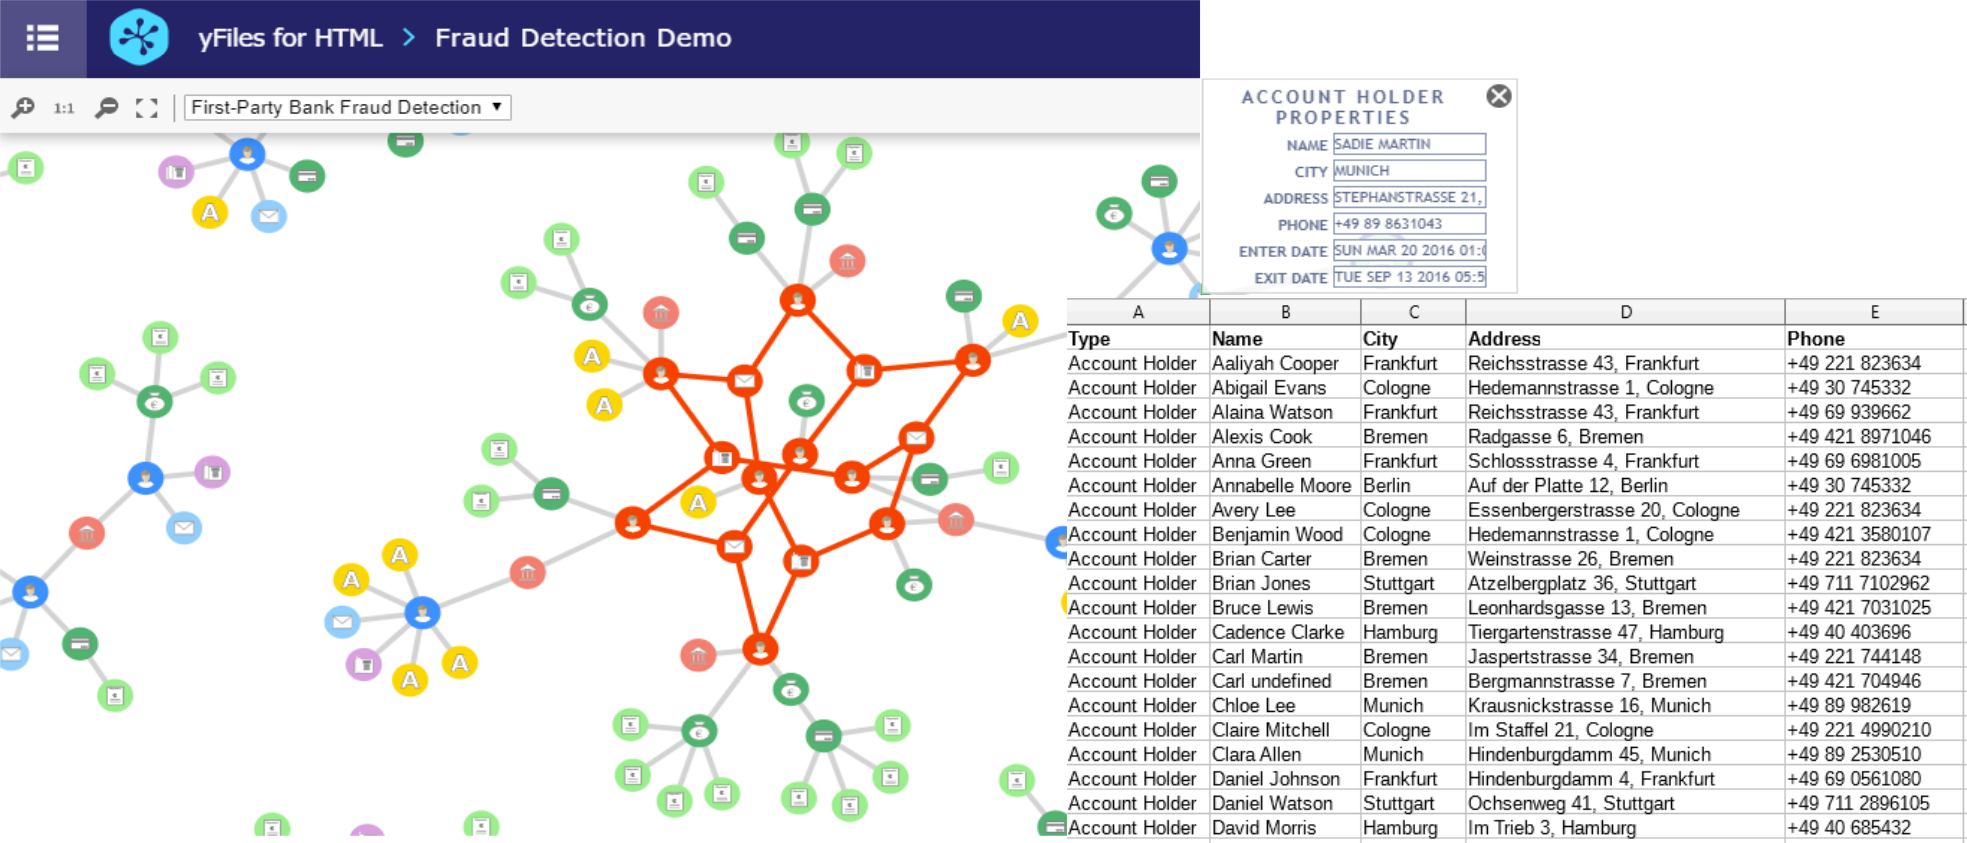
A typical pattern to look for is the so-called fraud ring . Fraud rings are persons that form cycles and share the same contact information. More precisely, in a first-party bank fraud scenario, auditors could look for potential fraud rings. In this scenario, visualization helps to detect fraud cases easier than digging into a large number of database raws.
Challenges of visualizations for first-party bank fraud detection
One of the most challenging tasks when using visualization for fraud detection is the sheer amount of data that is usually obtained by auditing systems.
First, the auditor has to retrieve the data from the auditing system.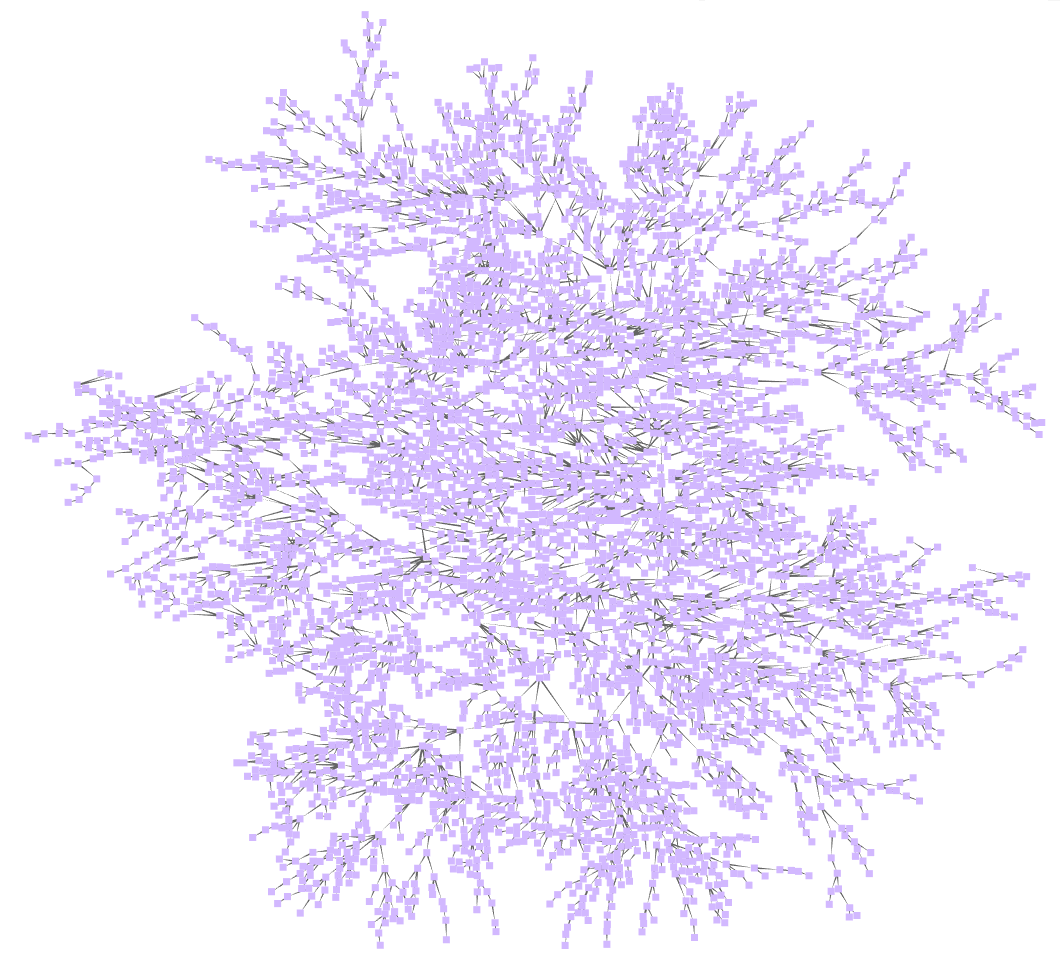
An unstructured “hairball” graph makes it hard to detect fraud patterns
Visualizing such a large amount of data is the next challenge: the data needs a meaningful arrangement to create a human-readable representation. Providing suitable styling should enable users to identify different types of entities and relations.
Furthermore, high performance is essential to allow for interactive exploration of the data utilizing the benefits of graph database visualization.
How to create visualizations for first-party bank fraud detection?
A typical fraud-scenario involves two or more persons that share the same fake personal information such as address or phone number and apply for several bank products.
Therefore, a common mechanism when trying to combat first-party bank fraud is to create a graph in which associates each person with some contact information like an address, a phone number, a bank branch, and a series of bank products, including possible payments for these products. Each person and every single information is represented by a node (also called vertex or entity). To keep the diagram readable, each node should be visualized differently based on its type.
Building such a visualization from scratch can be a challenging task. However, developers can save a lot of money, time, and workforce by using a software library that provides ready-to-use components for this task.
yFiles for HTML is a commercial programming library designed explicitly for diagram visualization and is a perfect fit for the challenges of fraud detection. The sophisticated layout algorithms of yFiles can comfortably transform the data in a readable, leasing, and informative network. The different layout styles enable the user to intuitively identify structural characteristics of the data, such as cycles, connected components, or hierarchies.
First-party bank fraud application using yFiles for HTML
yFiles for HTML comes with a Fraud Detection Sample Application. It provides a visualization of time-dependent
data for the detection of first-party bank fraud. The example consists of three different parts: the main diagram, the timeline component,
and the details component.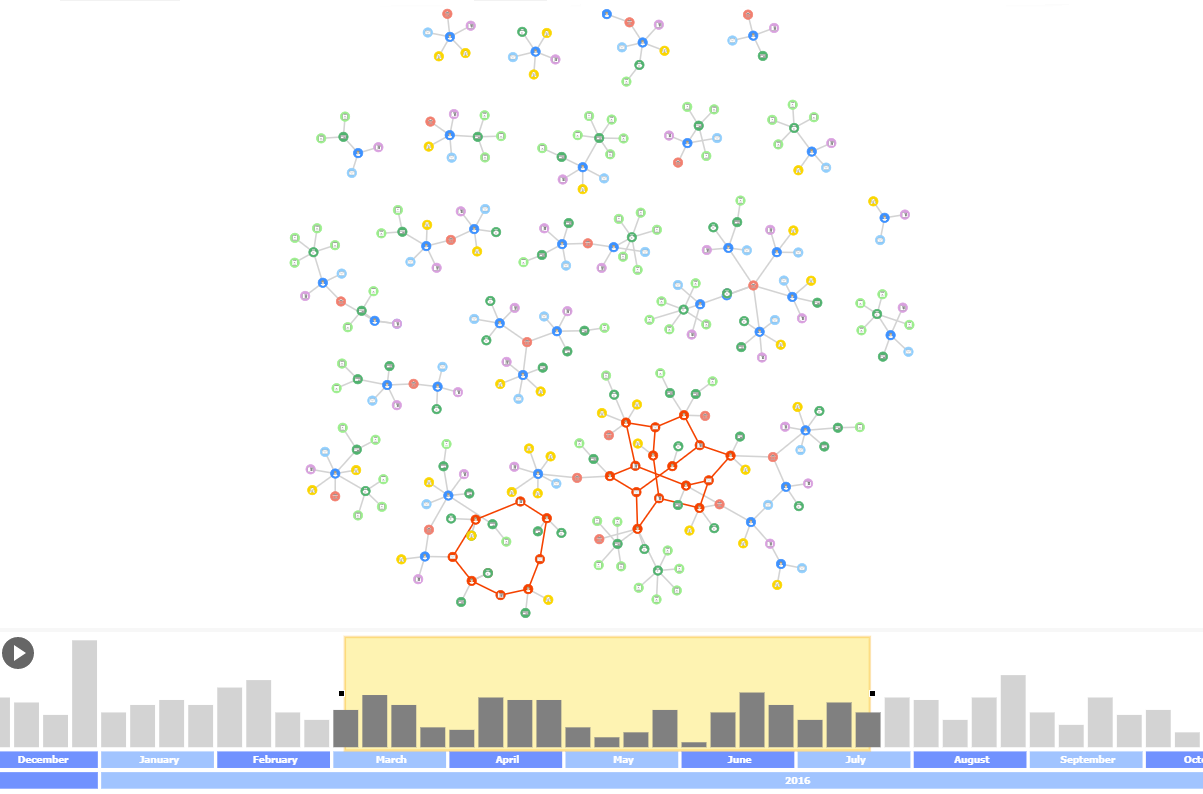
Bank fraud visualization with time-dependent data
The main diagram
Each node of the main graph visualization represents a type of data like person, address, or phone number. The node types are easily distinguishable due to different visualization styles, using the flexible diagram visualization capabilities of yFiles for HTML. All nodes are also associated with two timestamps, one for their creation and one for their removal. For example, when a node represents a loan, the first timestamp denotes the time when the credit is requested and the last when it is repaid. Based on these two timestamps, the nodes are filtered and appear in the main visualization only within a specific time interval.
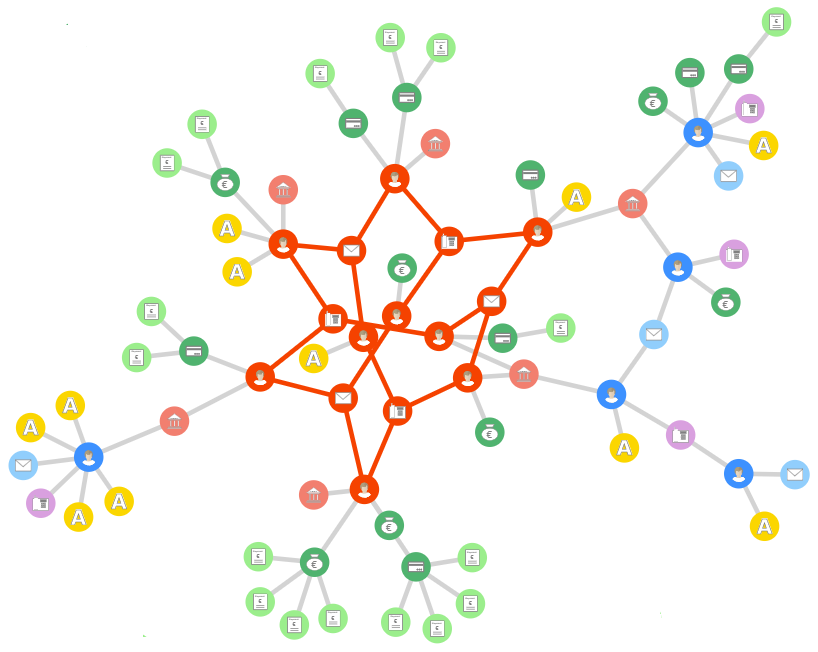
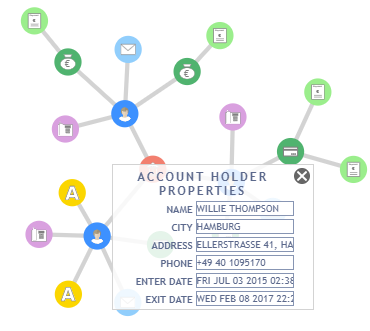
The main window also comes with a fraud detection mechanism that highlights with red color the nodes that may be involved in a potential fraud ring. Thus, the auditor can distinguish possible fraud rings at a glance and investigate them further. A popup menu is provided to display the properties of each node and facilitate the investigation. The fraud rings are directed using the graph analysis capabilities of yFiles for HTML.
The timeline component
The timeline component is built upon the time-dependent data of the main graph visualization.
It shows the overall number of creation and removal events with a bar for each timestamp. It is also equipped with a time-frame rectangle to
select the time interval that is important for the user. This time-frame is resizable and can be dragged to fit the user’s needs.
Based on the selected time interval, the nodes of the graph are filtered so that only the ones whose time interval overlap with the chosen time interval are visible in the graph.
In this manner, the main visualization remains uncluttered, and the user can focus only on the currently visible elements.
First-party bank fraud demo timeline
The timeline component provides a video button that automatically moves the time-frame to the right while updating the main graph. In this manner, the auditor can obtain an overall view of the dataset while it is also possible to stop the video when a fraud ring is detected to investigate it further and determine whether this refers to an actual fraud case.
During the movement of the time-frame, the graph structure evolves, i.e., new nodes and edges are added in the visualization while other elements disappear. One of the most critical challenges with an evolving graph is to adapt the visualization to these graph changes. For example, new graph elements have to be arranged, and, after node removals, the remaining graph elements have to be re-arranged. However, these operations have to be performed in a way that the overall picture of the graph, the so-called mental map, remains stable to keep the user from getting confused.
This example application uses an algorithm for the node arrangement that adapts possible graph changes. Algorithms that arrange elements in a diagram or, as they might also be called, automatic layout algorithms are one of the key features of yFiles for HTML.
Both the main graph visualization and the timeline component can coordinate so that when a node in the main graph is highlighted/selected, the corresponding timestamps of the timeline component are highlighted/selected and vice-versa.
The details component
When a fraud ring is detected, the auditor can switch to the detailed view with a timeline component, which displays a snapshot
of the graph that contains only the nodes involved in the fraud ring. With this additional filtering operation,
the auditor can focus only on the fraud ring without being distracted by the remaining graph elements that have no relation with the
potential fraud component.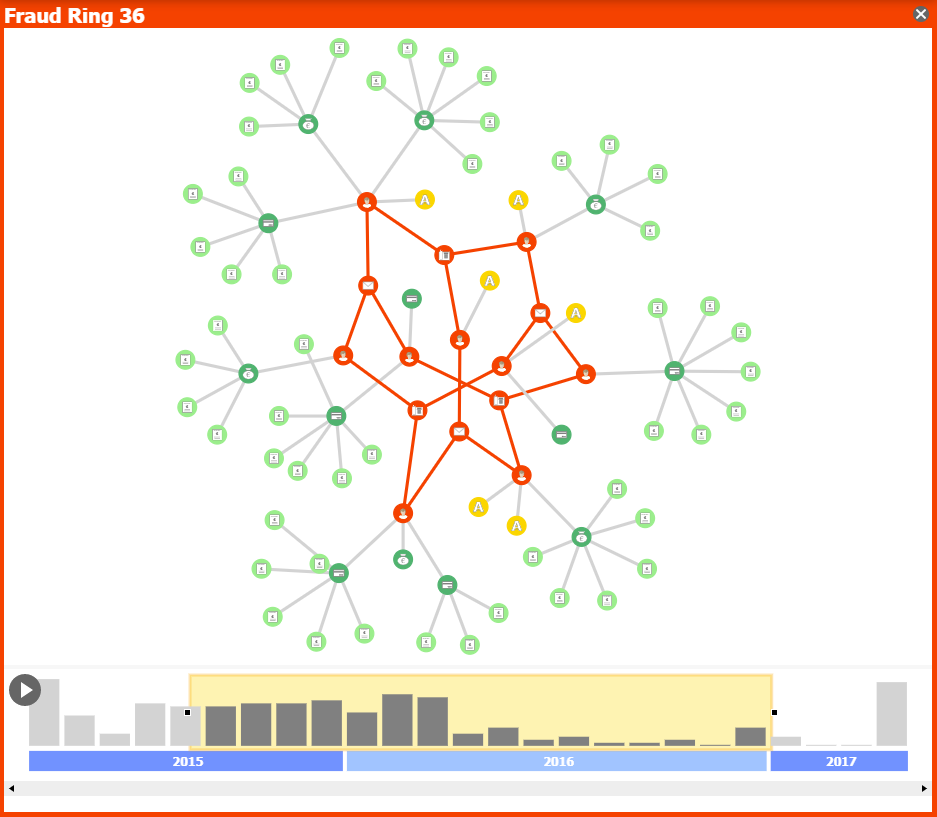
First-party bank fraud demo detailed view
About yFiles: The graph visualization SDK
yFiles is your go-to SDK for crafting advanced graph visualizations, whether you're working with Web, Java, or .NET technologies. Its unmatched flexibility and scalability enable you to convert complex data into clear, actionable visuals, fitting for both enterprise and startup needs.
With yFiles, you're equipped for the future—supporting any data source while maintaining strong data security. Getting started is seamless, thanks to over 300 source-code demos, thorough documentation, and direct access to core developer support. These resources are available even during your free trial.
Backed by 25 years of graph drawing expertise, yFiles is trusted by top companies worldwide for their most critical visualization tasks.
Discover yFiles11 reasons why fraud detection developers trust yFiles!

yFiles Newsletter
Stay informed about yFiles, network visualization, and graph technology updates.
Join our newsletterExamples source code
With yFiles, fraud detection diagrams can be realized on all supported platforms. The source code of the Fraud Detection Sample Application that comes with yFiles for HTML is available on the yWorks GitHub repository and part of the yFiles for HTML package.
Fraud detection demo


