Immersive Graph Visualization in 3D, AR & VR Understand complex networks interactively—in any browser, in 3D or VR
Graphs and networks often contain complex structures that are difficult to grasp in two dimensions. A three‑dimensional or immersive representation adds depth and perspective, helping users recognize relationships and spatial groupings more intuitively.
Modern web technologies such as WebXR make it possible to explore graph data directly in augmented or virtual reality – without additional software installation. This opens new ways to present, teach, and analyze connections in data.
The concept can be seen in action in the browser‑based tool yEd Live, which demonstrates how network layouts created with yFiles can be viewed and explored in an interactive 3D or VR scene.
Typical applications include exploratory data analysis, educational visualizations, collaborative design sessions, and prototypes of AR/VR interfaces for web applications.

Why visualize graphs in augmented & virtual reality?
Graph and network data often become easier to interpret when viewed in three dimensions. Augmented and virtual reality add spatial perception and depth, offering new ways to explore complex connections.
Immersive perspective
Additional dimension
Flexible scale and viewpoint
Natural interaction
Improved readability
Broad accessibility
Interactive 3D visualizations often help reveal hidden patterns and make structural correlations more apparent.
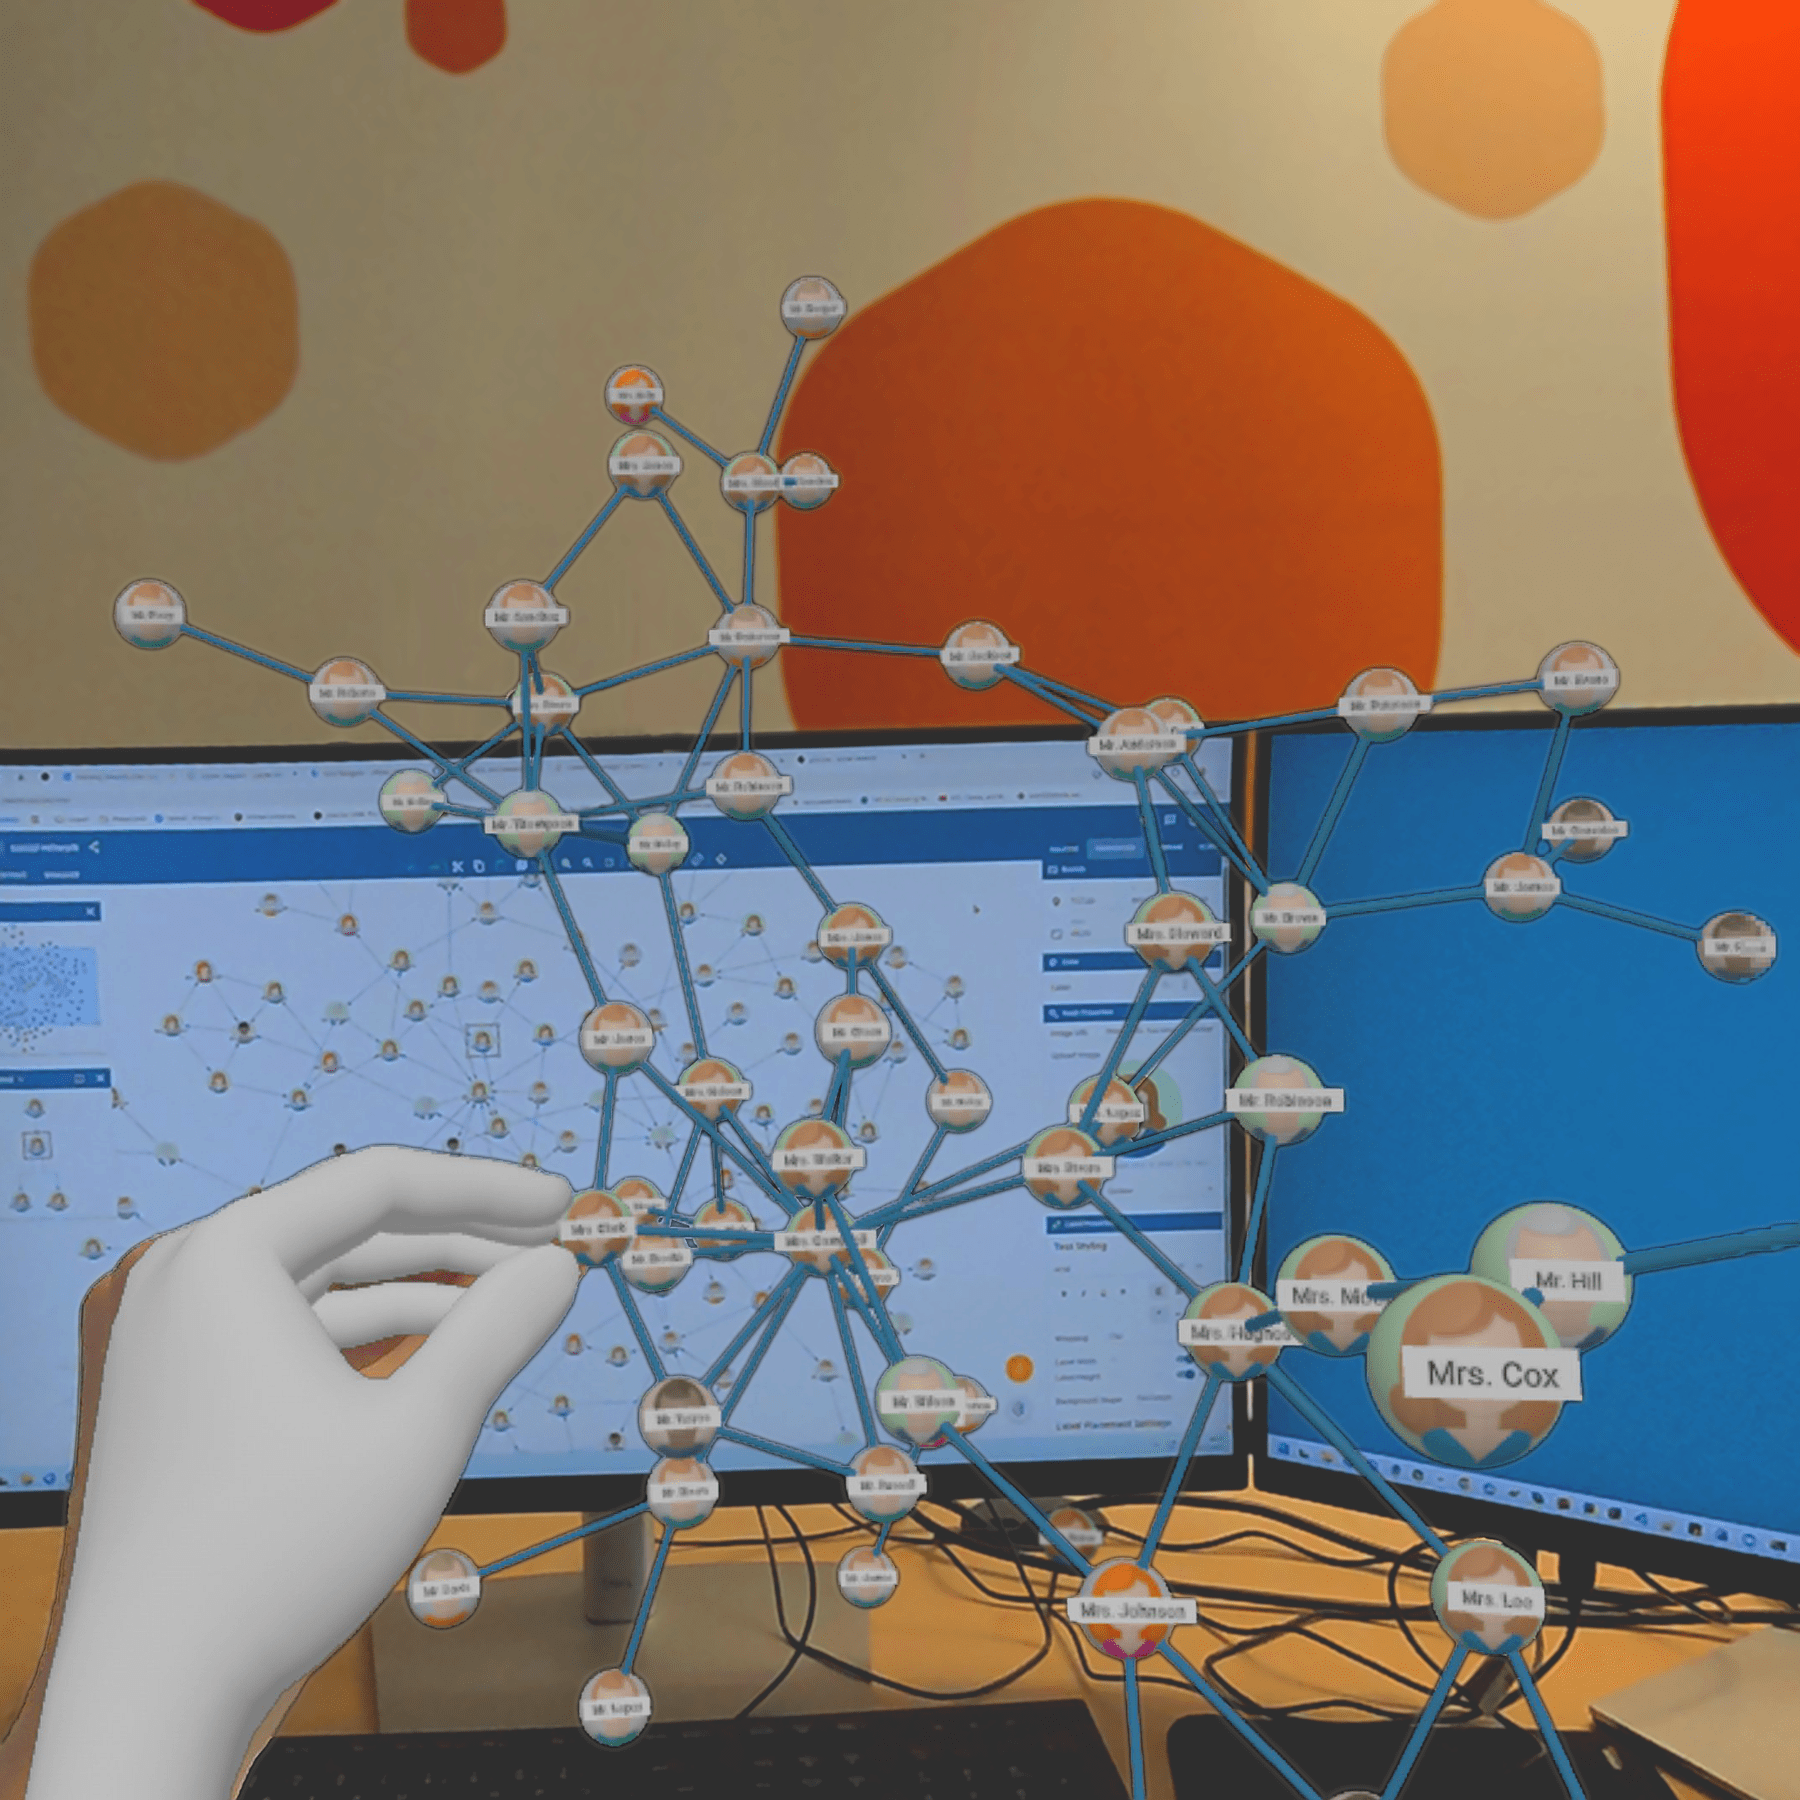
How it works — technical overview
Rendering stack
Data flow
Interaction and controls
Performance considerations
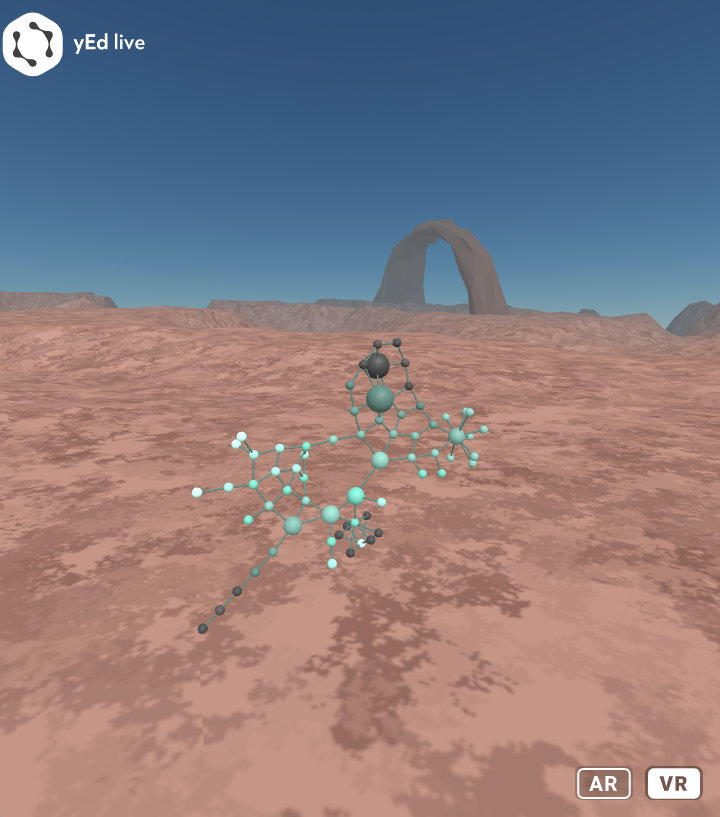
Example: Exploring a diagram in AR/VR using yEd Live
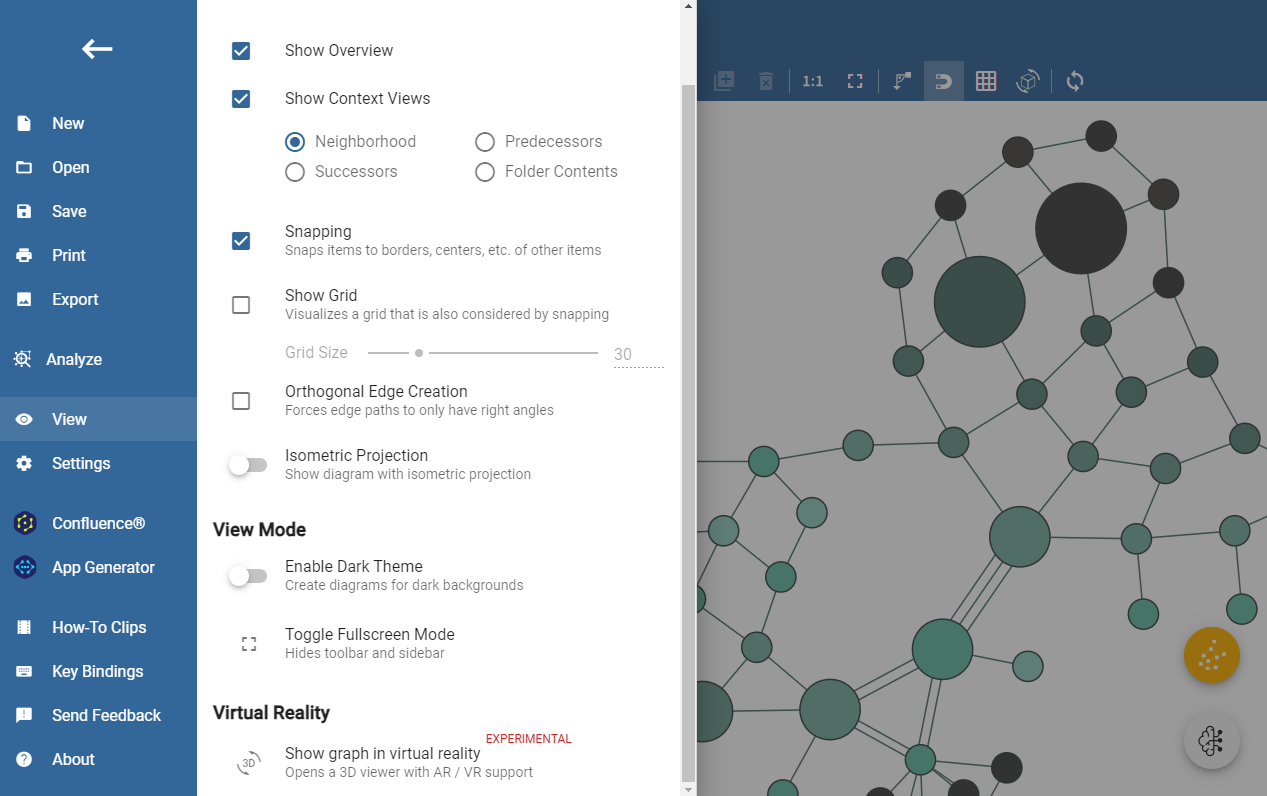
Short developer note: minimal export idea
  // Pseudocode: yFiles -> A-Frame geometry export (concept)
const nodes = graph.nodes.map(n => ({ id: n.id, pos: { x: n.x, y: n.y, z: n.z || 0 }, data: n.tag }));
const edges = graph.edges.map(e => ({ from: e.source.id, to: e.target.id }));
// send to 3D runtime (A-Frame): create entities for nodes and lines for edges
// For yEd Live this is handled internally; for custom apps use yFiles for HTML to compute positions and export them.

Typical use cases
- Exploratory data analysis of complex networks
- Educational visualizations and interactive lectures
- Stakeholder presentations and demos
- Collaborative walkthroughs in mixed/remote settings
- Prototyping WebXR features for product UIs
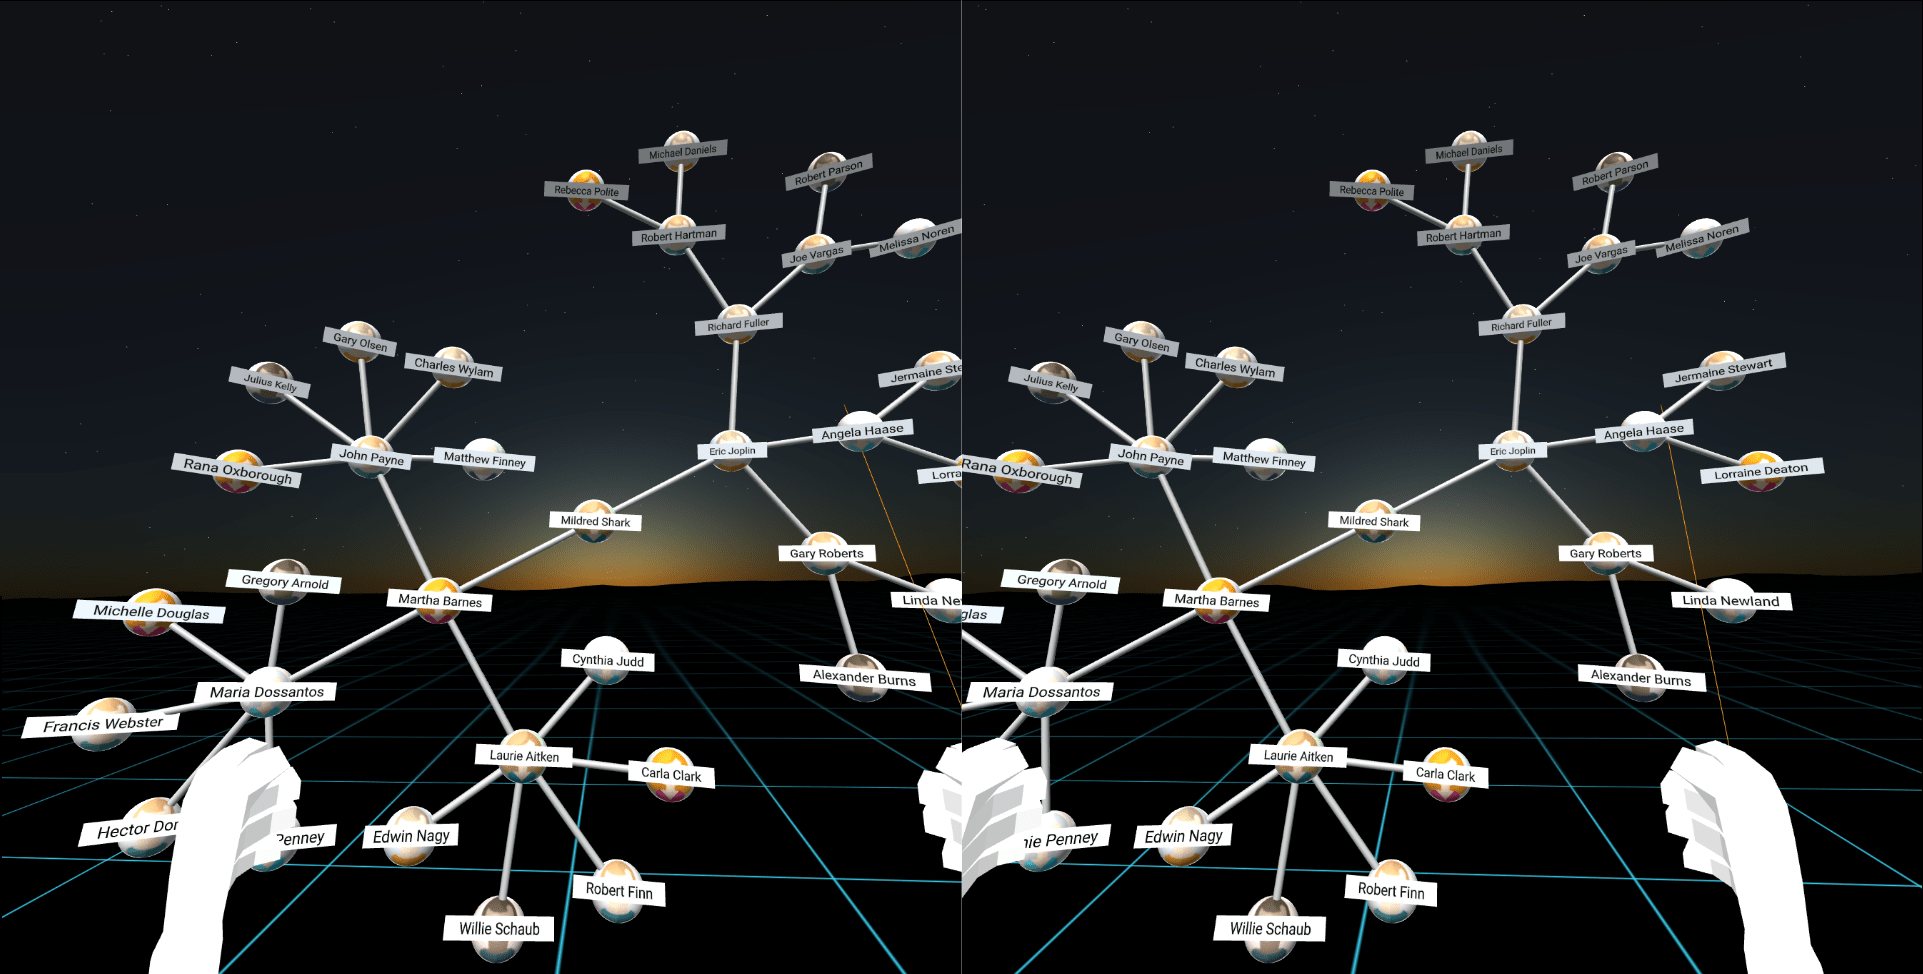
Integration & developer notes
Recommended product: yFiles for HTML to compute geometry and apply layouts. Export positions and attributes to your WebXR runtime (A-Frame/three.js) and map nodes/edges to 3D entities.
Implementation tips: use instanced rendering for many nodes, simplify edges at a distance, perform layout asynchronously for large datasets, and provide a desktop fallback for non‑WebXR clients.
Standards: prefer WebXR where available; support WebVR fallbacks if required. Add accessibility alternatives and consider passive vs. active experiences depending on input availability.
Frequently Asked Questions
Do I need a VR headset for VR visualization with yEd Live?
What is the Organic (force-directed) layout in yFiles, and how does it relate to AR and VR applications?
The Organic layout in yFiles is a force‑directed algorithm that internally calculates node positions in three dimensions. While the default visualization projects this 3D model onto a 2D plane, you can directly access and utilize the native x/y/z coordinates for immersive AR and VR scenes. This makes integrating realistic 3D network visualizations into WebXR experiences remarkably straightforward.
Which devices are supported by the yFiles VR visualization tool?
Can yFiles handle large graphs in VR?
What is the Organic (force-directed) layout in yFiles, and how does it relate to AR and VR applications?
The Organic layout in yFiles is a force‑directed algorithm that internally calculates node positions in three dimensions. While the default visualization projects this 3D model onto a 2D plane, you can directly access and utilize the native x/y/z coordinates for immersive AR and VR scenes. This makes integrating realistic 3D network visualizations into WebXR experiences remarkably straightforward.
How are interactions handled in the yFiles VR visualization tool?
yFiles uses A-Frame, a web framework whose components map controller gestures, pointer, and gaze to grab/scale/rotate operations; custom handlers can be implemented.
Is the yEd Live VR viewer production-ready?

Thank you!
Your message has been sent.
We'll get back to you as soon as possible.
About yFiles: The graph visualization SDK

yFiles is your go-to SDK for crafting advanced graph visualizations, whether you're working with Web, Java, or .NET technologies. Its unmatched flexibility and scalability enable you to convert complex data into clear, actionable visuals, fitting for both enterprise and startup needs.
With yFiles, you're equipped for the future—supporting any data source while maintaining strong data security. Getting started is seamless, thanks to over 300 source-code demos, thorough documentation, and direct access to core developer support. These resources are available even during your free trial.
Backed by 25 years of graph drawing expertise, yFiles is trusted by top companies worldwide for their most critical visualization tasks.
11 reasons why developers choose yFiles, the superior diagramming SDK








Recap
AR & VR Graph Visualization

Visualize graphs in augmented and virtual reality using yFiles for HTML together with modern WebXR tooling. The yEd Live VR viewer demonstrates the approach: yFiles computes layouts and geometry which are rendered in a WebXR-capable 3D runtime (A-Frame + three.js). This enables immersive, interactive exploration of complex network data with browser-based access and desktop fallbacks.
Benefits include improved readability through the third dimension, flexible perspectives, interactive manipulation, and scalable strategies for handling large graphs. Use cases range from exploratory analysis and teaching to stakeholder demos and prototype integrations into web applications.
Related content
Choose your next steps
Get connected
Connect with our Customer Success Team regarding your ideas or projects.

Download yFiles
Try yFiles free of charge.