Exploring Interactive Graphs: Boost User Engagement with Advanced TechniquesWebinar series — The Art of Graph Visualization
Episode 5
Episode 5
Welcome to the fifth episode of "The Art of Graph Visualization," presented by Dr. Benjamin Niedermann.
In this session, titled "Interaction Techniques," you'll learn how to embed interactive elements into your graph visualizations to enhance user engagement. Dr. Niedermann covers various techniques such as hover effects, clickable nodes, and other interactive features that provide deeper insights into your data. Learn how to apply interactive graph visualization techniques to create dynamic and user-engaging graphs.
The session is presented by Dr. Benjamin Niedermann, a Senior Algorithm Engineer in the Layout Team at yWorks, sharing his expertise in graph algorithms and interactive visualization methods.

Enhance your graphs with interactive elements using yFiles
Whether you're new to graph visualizations or looking to "add interactive features to your graphs," yFiles offers the tools you need. With our free trial, you can explore interaction techniques like "hover effects, clickable nodes, and more," with support from our premium core developer team.
Take advantage of this opportunity to create interactive, "user-engaging graphs" across platforms like Web, Java, and .NET.
Start your journey with yFiles today!
Download yFiles now!

We´d love to help you. Reach out and we'll get in touch with you.
Your message has been sent.
Watch the full webinar episode
Watch the full episode below to learn "how to add interaction techniques to your graph visualizations." Dr. Benjamin Niedermann demonstrates "interactive features like hover effects and clickable nodes" and how they can significantly enhance user engagement in data visualizations.

About yFiles: The graph visualization SDK

yFiles is your go-to SDK for crafting advanced graph visualizations, whether you're working with Web, Java, or .NET technologies. Its unmatched flexibility and scalability enable you to convert complex data into clear, actionable visuals, fitting for both enterprise and startup needs.
With yFiles, you're equipped for the future—supporting any data source while maintaining strong data security. Getting started is seamless, thanks to over 300 source-code demos, thorough documentation, and direct access to core developer support. These resources are available even during your free trial.
Backed by 25 years of graph drawing expertise, yFiles is trusted by top companies worldwide for their most critical visualization tasks.
Discover yFiles11 reasons to build interactive graph apps with yFiles!

yFiles Newsletter
Stay informed about yFiles, network visualization, and graph technology updates.
Join our newsletterKey topics covered in this webinar
- Embedding interaction techniques in graph visualizations
- Using "hover effects" and "clickable nodes" to enhance user engagement
- Applying interaction design principles in graphs
- Integrating interactive features into various technologies: "HTML, CSS, SVG, WebGL"
- Live Q&A session with yWorks graph visualization experts
Detailed breakdown of this episode
- 00:00 Introduction: Overview of the webinar series and episode objectives.
- 02:19 Overview: Introduction to the session's main topics.
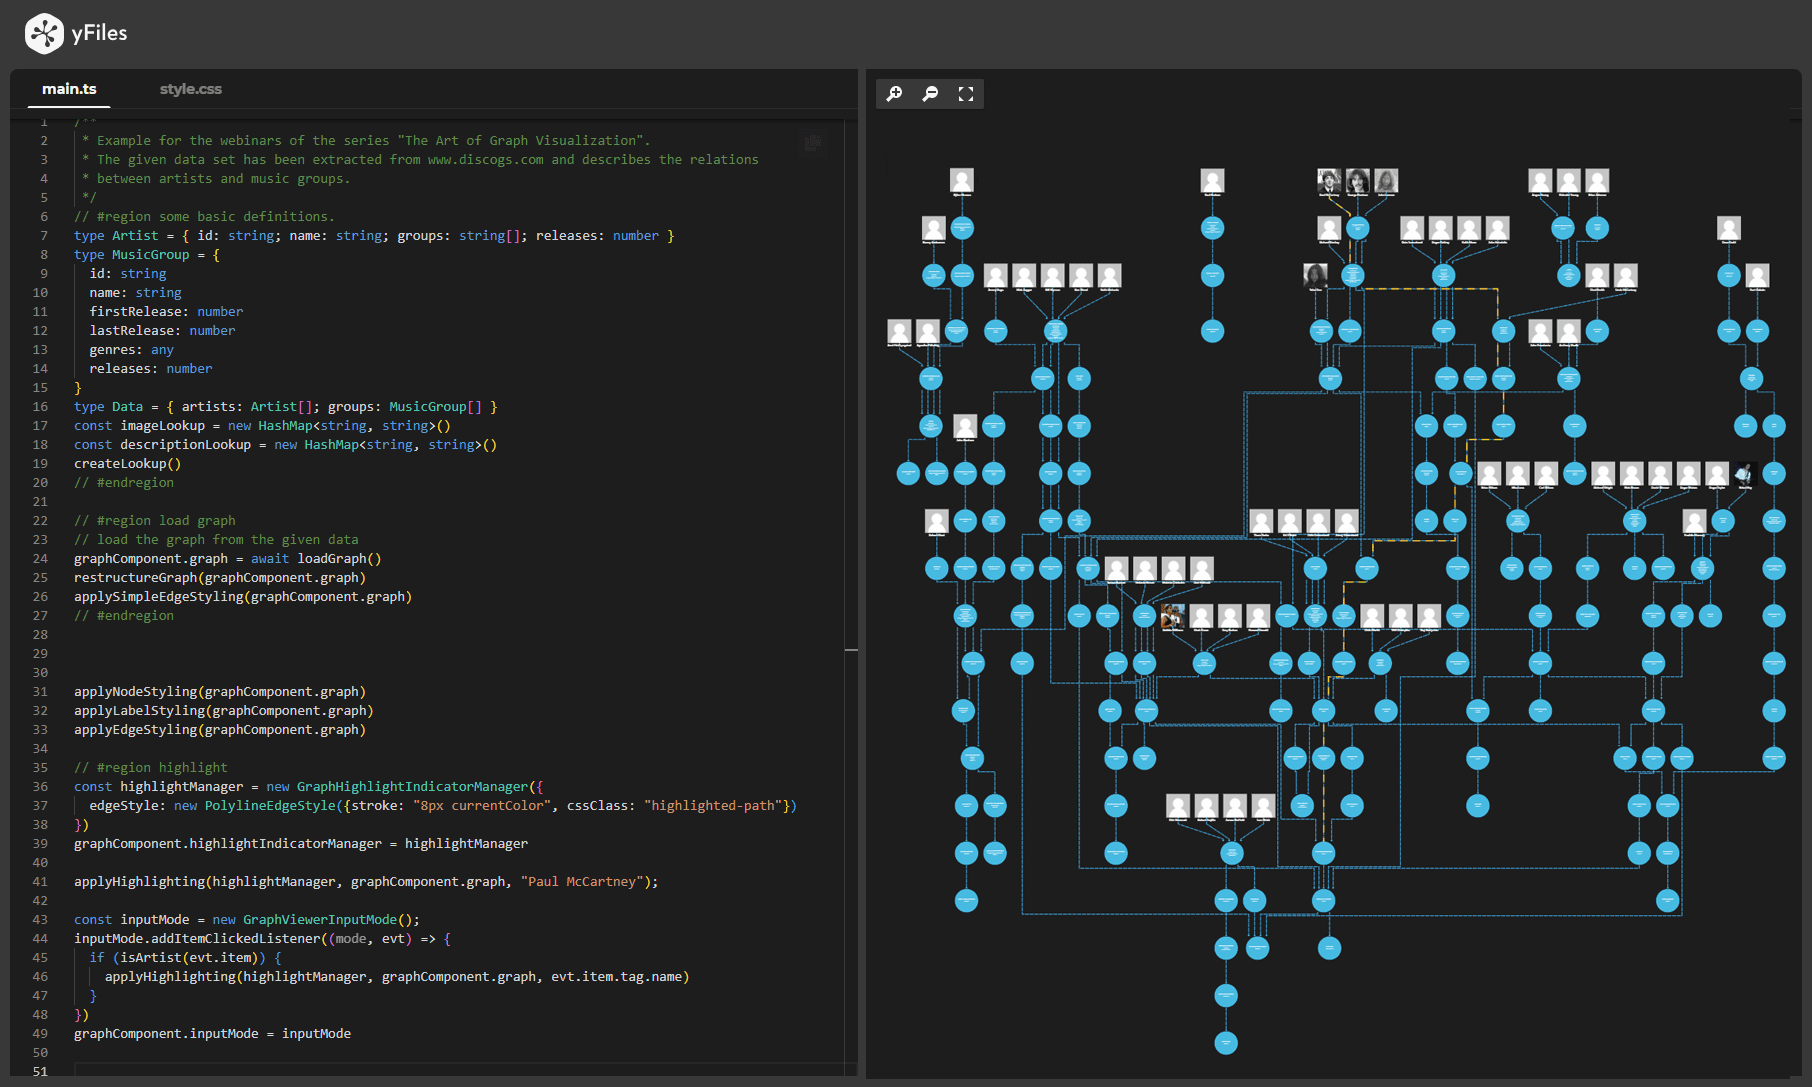
- 04:04 Example: History of Artists: Analysis of artist history data.
- 08:39 Target Elements: Identifying key elements for interaction.
- 10:10 Tasks: Defining tasks and actions for interactivity.
- 30:27 Principles: Exploring key design principles for interaction.
- 40:41 Actions: Implementing interactive actions.
- 55:05 Next and Previous Webinars: Preview of upcoming and review of previous webinars.
- 55:53 Q&A session: Dr. Benjamin Niedermann answers audience questions.
Playground programming examples
The yFiles Playground is an interactive platform where you can experiment with streamlined programming examples from our webinars, such as data analysis, layout algorithms, and interactive elements, all directly in your browser. Designed for developers, the Playground provides practical experience with these examples, enabling you to effectively apply yFiles concepts without needing any local installation.
Enhance your graph visualizations with yFiles!
Try yFiles freeAdditional episode resources
- Explore yFiles Demos: See practical examples of graph visualization in action.
- Learn more about yFiles: Discover more about the capabilities of yFiles.
- Evaluate yFiles for Free: Get hands-on with yFiles by evaluating it for free.
- yEd Live: Try this free online diagramming tool.
- Data Explorer for Neo4j: Explore graph databases with this tool.
- App Generator: Create custom graph applications.
- Python Diagrams: Generate diagrams using Python.


