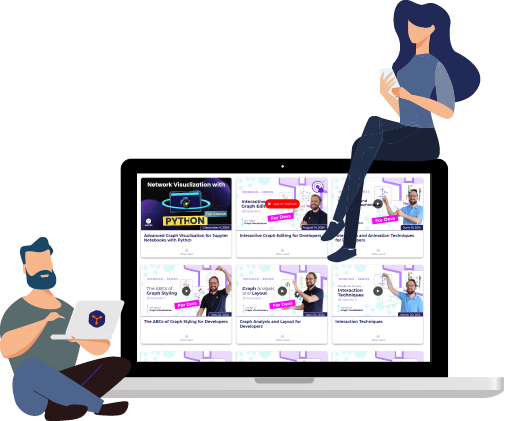
Learn Graph VisualizationExpert webinars and tutorials
Welcome to the yWorks Webinars page! Here, you'll find a wealth of knowledge directly from the diagramming experts. With over 25 years of experience in visualizing connected data, our team of more than 35 specialists is passionate about helping you navigate the complexities of graph visualization.
yFiles regularly hosts live webinars that dive deep into various aspects of graph visualization, complete with interactive Q&A sessions. These sessions are led by our core developers, ensuring you receive expert guidance and insider tips. Whether you're interested in a specific topic or want to follow an entire series, our webinars are designed to enhance your understanding and skills.
Missed a live session? No worries! You can catch up on all the webinars on the yWorks' webinars page or visit the yWorks YouTube channel to watch the entire collection. Stay up to date with the latest insights and techniques by subscribing to the channel.
Ready to start learning? Explore all upcoming and past webinars below and take your graph visualization expertise to the next level.

Gain the benefits of watching the yFiles webinar series on graph visualization
yWorks created a range of webinar series designed to deepen your understanding of graph visualization techniques and applications. These series provide expert insights, guided by yFiles core developers, and are ideal for anyone looking to elevate their skills in visualizing connected data.
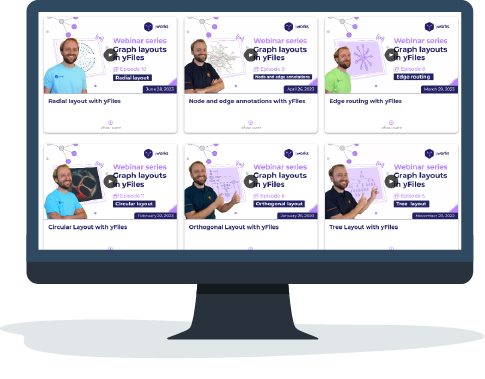
Graph layouts in yFiles
The "Graph Layouts in yFiles" webinar series explores various layout algorithms available in yFiles, including hierarchic, organic, and tree layouts. Each episode explains how these layouts can be applied to real-world scenarios, helping you create effective and
visually appealing diagrams.
Learn more about the webinar series "Graph Layouts in yFiles".

The Art of Graph Visualization
"The Art of Graph Visualization" series covers advanced techniques for creating informative visual representations of complex data. Topics include optimizing visual layouts and enhancing user interaction to create functional and visually
compelling graphs.
Explore the series "The Art of Graph Visualization" here.
For additional learning resources, these webinars and more are available on the yWorks YouTube channel.
