Visualizing an OrientDB Graph DatabaseGain insights into your OrientDB database relationships through diagram visualizations
Graph databases like OrientDB provide effective ways to represent and analyze complex data structures. With yFiles for HTML, you can transform your OrientDB data into interactive and clear diagrams. Visualizing OrientDB data helps businesses understand data relationships, reduce analysis time, and improve workflow efficiency—making it a valuable asset for data mapping and database automation.
These diagrams reveal connections hidden in raw data. Whether you're analyzing data, building applications, or creating dashboards, yFiles offers the tools you need to make the most of your OrientDB data.
Powerful Graph Visualizations for OrientDB with yFiles
yFiles gives you the tools to create clear and scalable graph visualizations for your OrientDB database. With advanced automatic layouts, you can focus on analyzing and optimizing your graph data instead of arranging nodes manually.
Leverage interactive features, animations, and flexible styling to build dynamic graph applications. yFiles seamlessly integrates with web technologies, making it easy to bring OrientDB data to life in any application.
Start visualizing your OrientDB graphs with yFiles today!
Prototype your own graph application

We´d love to help you. Reach out and we'll get in touch with you.
Your message has been sent.
What is OrientDB?
OrientDB is a multi-model database capable of efficiently storing and retrieving data like all traditional database systems while it also supports new functionality adopted from graph and document databases. It is written in Java and belongs to the NoSQL database family.
One of the core features of OrientDB is the support of multi-model objects, like Document, Graph, Key/Value, and Real Object. Each of these models can be manipulated using a separate API. Besides, OrientDB has been optimized in terms of performance on both read and write operations.
Why use a graphical representation of OrientDB data?
Visualizing a graph database is considered to give a tremendous benefit to the users as it offers a better insight into the content of the data. The user does not have to dig into the database’s raw data, making it easier to investigate the data, understand their relationships, and identify possible patterns and structures. Also, the user can interact with the visualization and interactively explore the data without any previous knowledge of the query language of the database.
Therefore, being able to provide a high-quality visualization of OrientDB could be a powerful solution when handling or analyzing vast amounts of data.

Challenges of graph database visualizations
While graph data is naturally suited for visualization, handling it remains challenging due to the large volumes typically involved.
The first step is querying the database. Afterward, the results need to be organized in a way that makes the data easy to understand. Clear styling that distinguishes between entity types and relationships, while showing their properties, greatly aids quick interpretation. And of course, fast performance is essential to allow users to explore the data interactively.
Creating a graph visualization from OrientDB data
OrientDB offers a graph editor that visualizes the data and allows interaction and data modification. More precisely, the user can write a query, and present the result as a graph in the graph area. Additional functionality like node addition, node deletion, and relationship navigation is also supported.
While this can be sufficient for many data sets, there exist many more complex use cases that either require specific interactions (e.g., drill-down, merging, filtering) or in which specific arrangements have to be applied to identify certain substructures in the data.
Utilizing a sophisticated visualization solution
A comprehensive visualization solution provides a means to create a client that enables users to gain more insight into the stored data. It can be tailored to specific requirements related to element visualization, element arrangement, or interactions.
yFiles for HTML is a commercial programming library explicitly designed for diagram visualization and is a perfect fit for the challenges of graph database visualization. Its sophisticated layout algorithms can easily transform the data in a readable, pleasing, and informative network. The different layout styles, for example, hierarchic, organic, tree, circular, or radial, enable the user to intuitively identify structural characteristics of the data, such as hierarchy, connected components, or rings.
Furthermore, yFiles for HTML comes with a multiplicity of graph analysis algorithms (e.g., centrality, clustering, path algorithms, etc.) that can be applied to the data model to add more value to the data.
Visualizing OrientDB with yFiles for HTML
OrientDB supports a variety of different APIs to access the data, among which SQL is often used to query the database. The easiest way is to convert the result in JSON format data objects with multiple properties that represent the stored entities.
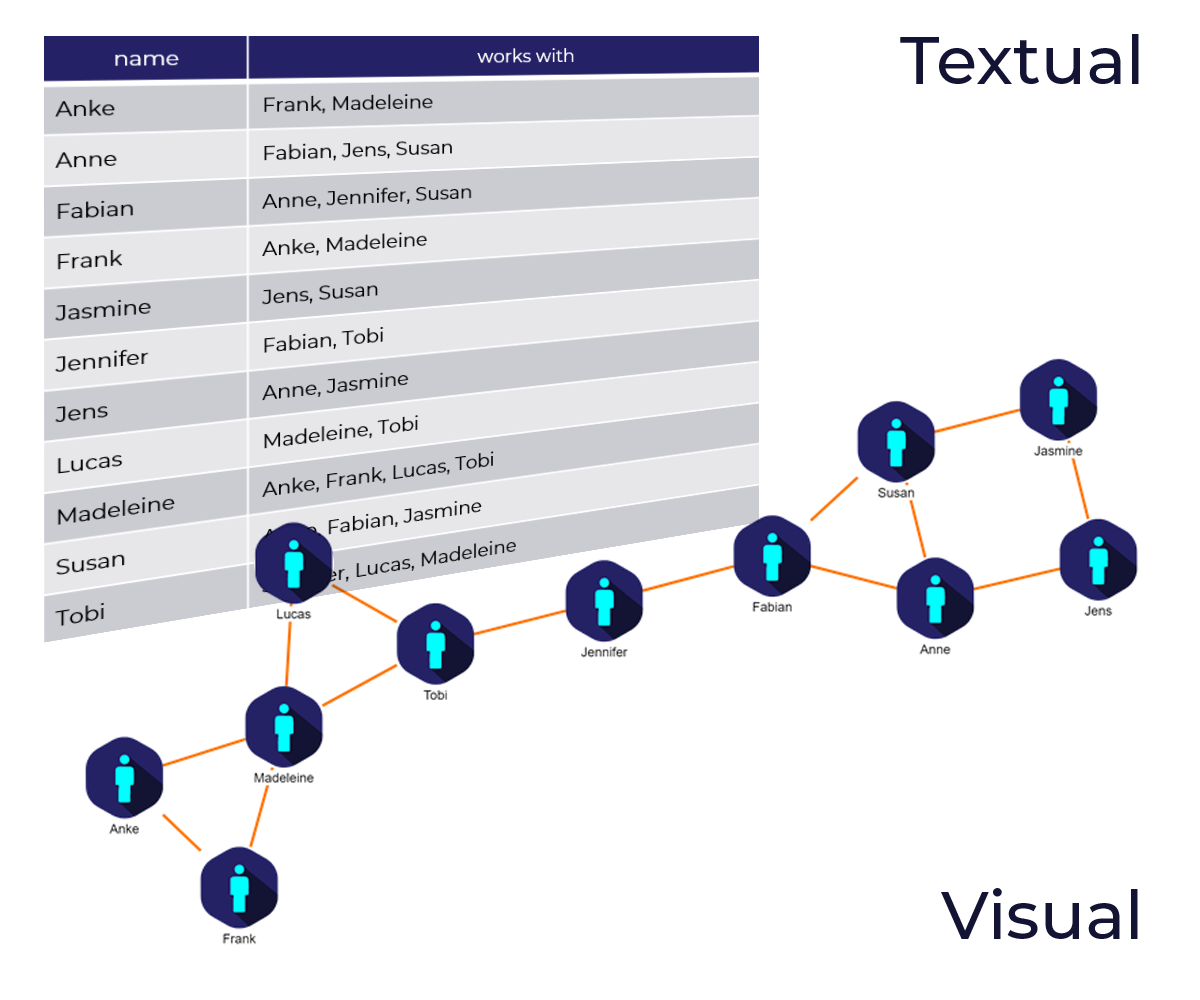
yFiles for HTML comes with a Graph Builder, which transforms the raw data from the JSON result into a graph structure. After building the graph structure, the full power of the yFiles for HTML diagramming library is at your disposal.
Data-driven visualization
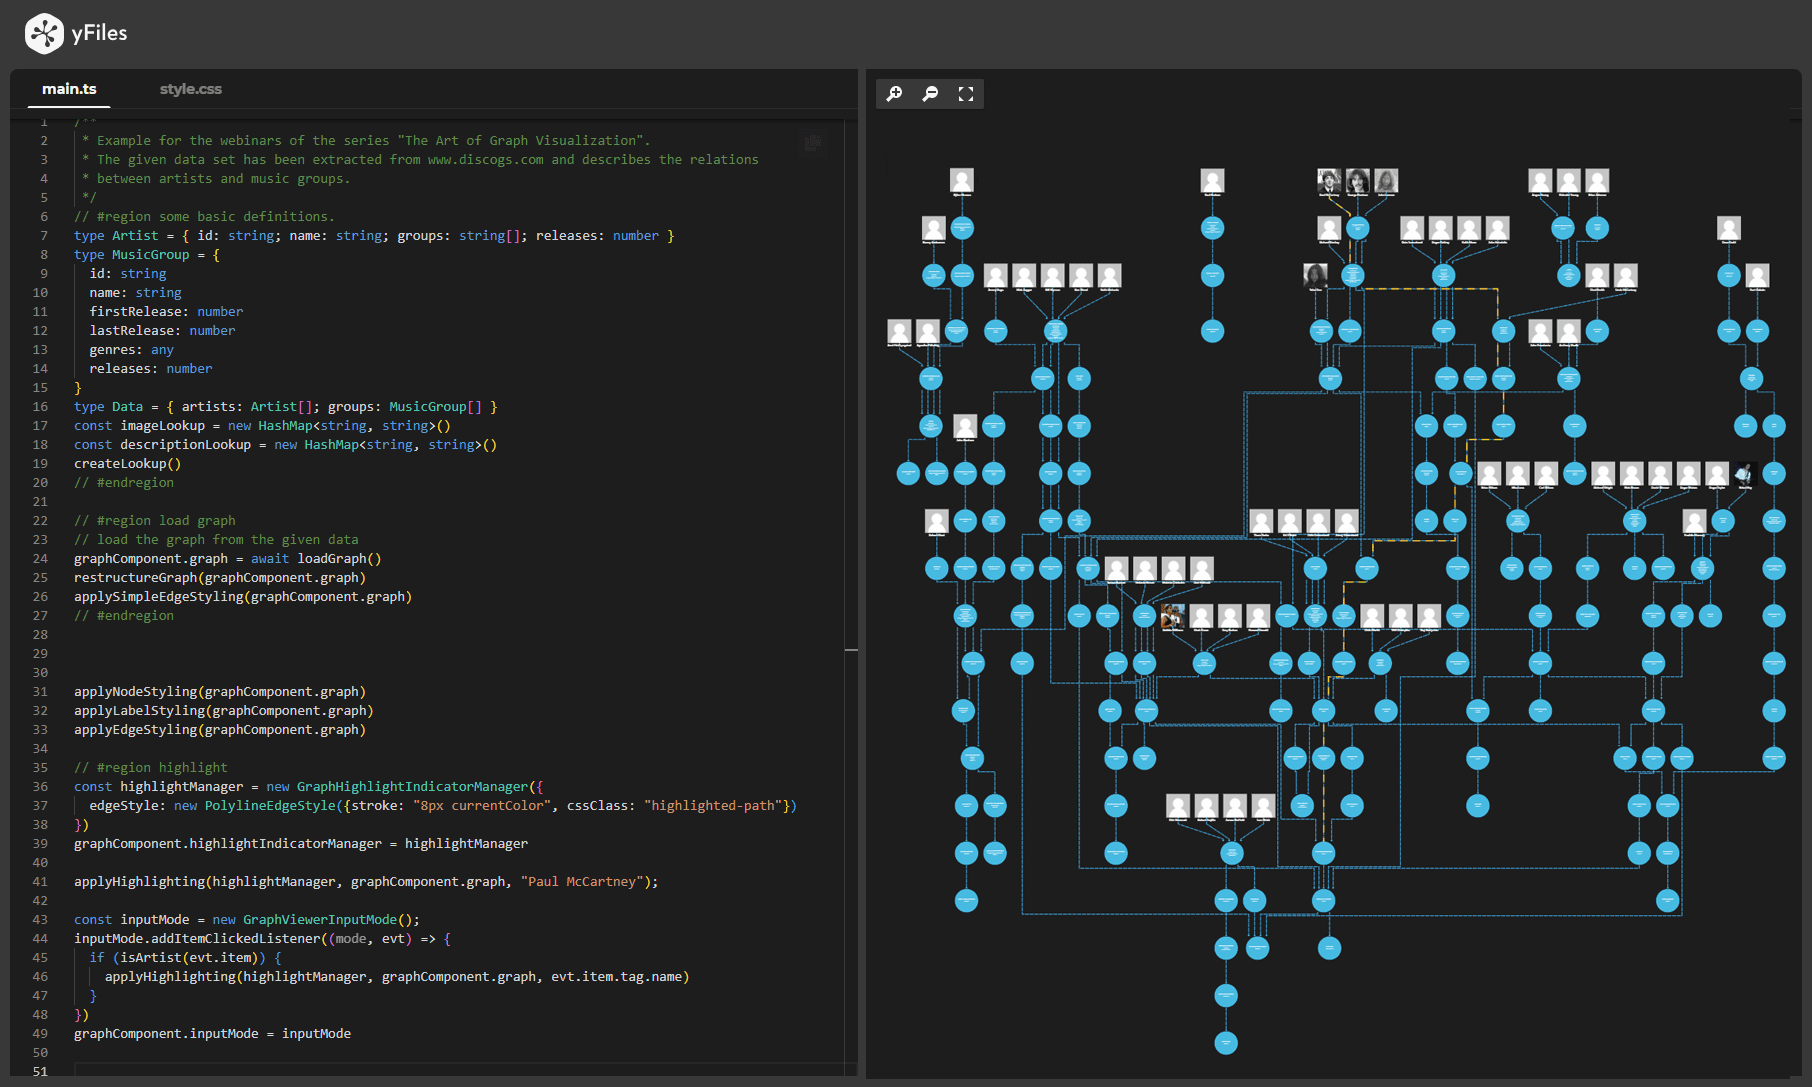
Effective visualizations reveal insights that aren’t immediately clear from raw data alone. yFiles for HTML offers multiple ways to turn OrientDB data into clear and meaningful diagrams. Users can leverage data binding features to build item templates that reflect labels and properties from the OrientDB database.

Automatic arrangement
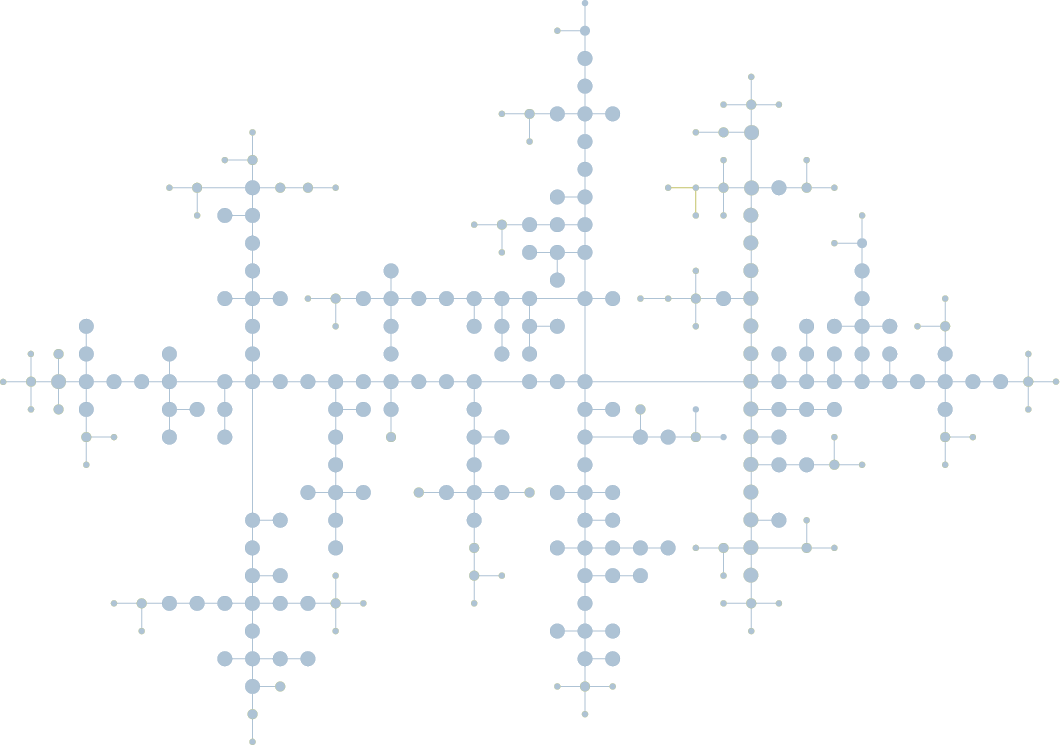
Automatic layouts can give you different perspectives on your data structure. In particular, they make it easy to identify substructures in your data like connected components, chains, circles, stars, and hierarchies. yFiles for HTML provides an extensive set of sophisticated, highly configurable automatic layout algorithms that arrange your data in a clear, concise, and readable manner in the blink of an eye.


Visual representations of different database types
Powerful exploration
An interactive application can provide much more functionality than a simple static representation. With yFiles for HTML, a graph visualization can be augmented with a considerable set of interactive features:
- Grouping lets you combine similar or related items to reduce visual complexity
- Drill down helps to explore specific parts of the data
- Filtering can be used to reduce the number of displayed entities without any additional database queries
- Data exploration and interactive modification is possible by mouse, keyboard and touch gestures
- Animations can help to provide a pleasant user experience
About yFiles: The graph visualization SDK

yFiles is your go-to SDK for crafting advanced graph visualizations, whether you're working with Web, Java, or .NET technologies. Its unmatched flexibility and scalability enable you to convert complex data into clear, actionable visuals, fitting for both enterprise and startup needs.
With yFiles, you're equipped for the future—supporting any data source while maintaining strong data security. Getting started is seamless, thanks to over 300 source-code demos, thorough documentation, and direct access to core developer support. These resources are available even during your free trial.
Backed by 25 years of graph drawing expertise, yFiles is trusted by top companies worldwide for their most critical visualization tasks.
Discover yFiles11 reasons why OrientDB developers trust yFiles!

yFiles Newsletter
Stay informed about yFiles, network visualization, and graph technology updates.
Join our newsletterWebinar: How to visualize database content with yFiles
This webinar demonstrates how to visualize a Neo4j database with yFiles for HTML in a simple web application built with JavaScript:

More information is also available in this blog post.


