Visualizing a Neo4j Graph DatabaseGain insights into your Neo4j database relationships through diagram visualizations
Visualizing graph databases like Neo4j unlocks powerful ways to understand and analyze complex data structures. With yFiles for HTML, you can transform your Neo4j data into interactive and insightful diagrams. By visualizing Neo4j data, businesses can achieve greater data relationship optimization, reduce analysis inefficiencies, and improve data-driven productivity, making it an essential tool for data mapping and database process automation. These visualizations allow you to discover relationships and patterns that remain hidden in raw data. Whether you're exploring data, developing applications, or building dashboards, yFiles provides the tools to fully leverage the potential of your Neo4j data.
Powerful Graph Visualizations for Neo4j with yFiles
yFiles gives you the tools to create clear and scalable graph visualizations for your Neo4j database. With advanced automatic layouts, you can focus on analyzing and optimizing your graph data instead of arranging nodes manually.
Leverage interactive features, animations, and flexible styling to build dynamic graph applications. yFiles seamlessly integrates with web technologies, making it easy to bring Neo4j data to life in any application.
Start visualizing your Neo4j graphs with yFiles today!
Prototype your own graph application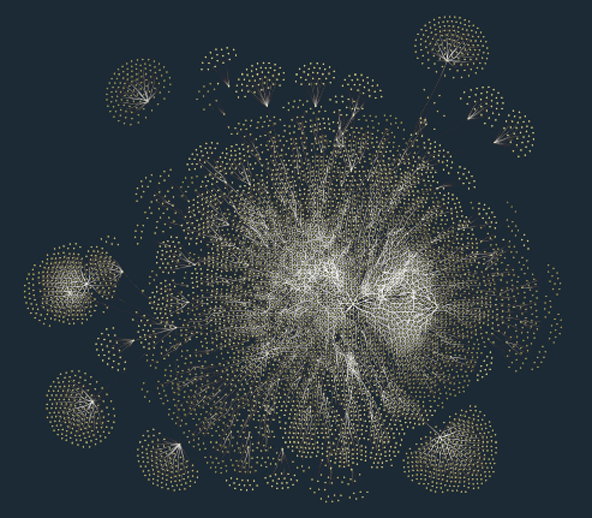
We´d love to help you. Reach out and we'll get in touch with you.
Your message has been sent.
What is Neo4j?
Neo4j, a graph database platform, is optimized to store large, connected datasets in a graph structure. It uses Cypher as its query language, supporting fast graph traversal and algorithms for graph analysis. As such, it is perfectly suited for storing and querying large amounts of connected data. When relationships between entities are crucial, a graph database like Neo4j is essential for understanding and managing complex data structures.
Creating a graph visualization from Neo4j data
A visualization enables users to visually explore the stored data, identify significant structures, and get a better understanding of relationships. Besides the visual exploration, it is also possible to interactively edit the stored data by modifying the diagram without any Cypher knowledge, which enables non-technical users to explore and modify the data. For example, new nodes and relationships can be created using mouse gestures. Therefore, visualizing a graph database is a powerful solution when handling or analyzing vast amounts of data.
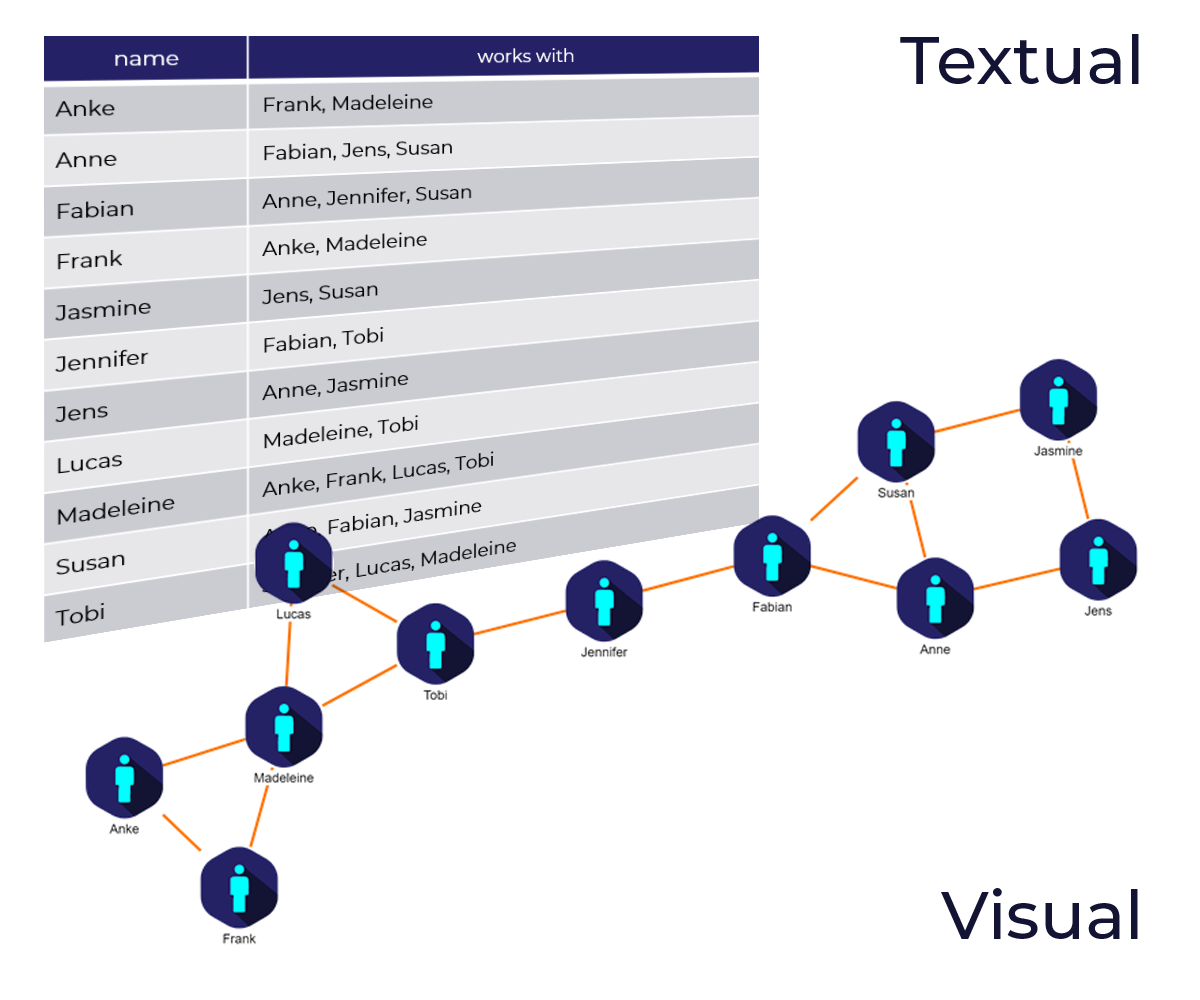
Neo4j comes with a built-in visualization tool. This tool lets you run Cypher queries and displays the result either as a table or in a simple, force-based diagram. While this is useful to learn Cypher and as a quick check if a query returns the right result, more complex tasks often require a sophisticated and customized visualization. Moreover, the built-in browser is mostly targeted at database developers and administrators. It’s not meant to be used by end-users and does not allow for an integration in sophisticated apps and dashboards.

Visualizing Neo4j data with yFiles
yFiles for HTML is a commercial programming library explicitly designed for diagram visualization and is a perfect fit for the challenges of graph database visualization. Its sophisticated layout algorithms can easily transform the data into a readable, pleasing, and informative network. With it, you can specify exactly what elements you want to see from your database, how they are represented, and how you can interact with it. It is possible to come up with bespoke interfaces with a great user-experience that perfectly matches the requirements of the end-user:
- Specify what information is loaded from the database
- Determine how the elements in the database are mapped to the visualization, e.g. whether to show transitive relationships or even whether to render relationships as connecting arrows or nested hierarchic graph structures
- Create custom designs for your entities to show exactly the information your users are interested in, right in the visualization. Use dynamic icons, progress-bars, gauges, images, colors, interactive elements, text labels, etc. for your item visualizations and level of detail visualizations to keep the visualization both clutter-free and informative at the same time
- Use data-driven layouts to highlight important aspects and structures in your data. The different layout styles, for example, hierarchic, organic, tree, circular, or radial, enable the user to intuitively identify structural characteristics of the data, such as hierarchy, connected components, or rings.
- Incrementally load more data, aggregate and group elements, and smoothly animate between these states
- Enable interactivity to let the user interact with the data both for exploratory purposes and to enable live modifications
Connecting yFiles for HTML with Neo4j
There are different ways to connect yFiles for HTML to a Neo4j data source. Depending on the type of application you can choose between multi-tier architectures where the application connects to a mid-tier level that possibly abstracts away the graph database access. For this, yFiles for HTML allows you to connect to any data source that you can access from the browser: Use REST APIs, GraphQL endpoints, SOAP, JSON, or even custom binary protocols. Whichever technology allows you to get your hands on the data in the browser can be used for driving the visualization.
On the other hand, you can also directly connect to the database without a complex server setup: Neo4j provides a standard JavaScript driver implementation that lets you connect to a database directly via the bolt protocol, making it easy to send Cypher Queries from JavaScript and Typescript code to the database. In return, you get JavaScript objects containing the data you queried from the database.
yFiles for HTML comes with a Graph Builder, which transforms the raw data resulting from a Cypher query into a graph structure. After building the graph structure, the full power of the yFiles diagramming library is at your disposal.
Data-driven visualization
A good visualization provides insights into the data that are not obvious by looking at the raw data. yFiles for HTML offers several ways to use the data from the Neo4j database to create a rich and meaningful representation. The user can take advantage of the powerful data binding capabilities to create item templates that utilize the labels and properties of the Neo4j data.

Automatic arrangement
Automatic layouts can give you different perspectives on your data structure. In particular, they make it easy to identify substructures in your data like connected components, chains, circles, stars, and hierarchies. yFiles for HTML provides an extensive set of sophisticated, highly configurable automatic layout algorithms that arrange your data in a clear, concise, and readable manner in the blink of an eye.


Visual representations of different database types
Powerful exploration
An interactive application can provide much more functionality than a simple static representation. With yFiles for HTML, a graph visualization can be augmented with a considerable set of interactive features:
- Grouping lets you combine similar or related items to reduce visual complexity
- Drill down helps to explore specific parts of the data
- Filtering can be used to reduce the number of displayed entities without any additional database queries
- Data exploration and interactive modification is possible by mouse, keyboard and touch gestures
- Animations can help to provide a pleasant user experience
Generating your own app with low-code tools
If you want to quickly scaffold your own application that connects to your database, consider using the App Generator for yFiles. It's a low-code tool that allows you to visually and interactively create graph visualization applications with a low-code approach. Generate a graph application in just ten minutes from scratch!
The generator is a web application that can be used without registration or sign-up at no fees. It comes with a number of neo4j-specific examples that show how to dynamically query the database contents and create bespoke visualization apps.
Once you are done with the setup, you can have the app create a source code bundle of the application that you designed with your choice of programming language and UI framework. Combined the bundle with yFiles for HTML and create stand-alone applications or integrate the results into your existing apps and dashboards.
Check out the Neo4j Movies Database live example to get started or watch the introductory video below to learn many of the advanced techniques:

Data Explorer for Neo4j - a free web application to explore your database
The Data Explorer for Neo4j is a free web application built with yFiles for HTML that connects to a Neo4j database. It can be used to explore the database schema and content visually and allows to apply different filters, styles, and automatic layouts on the stored content.

The Data Explorer even provides a direct export function to the aforementioned App Generator. With this you can go from exploring your database directly to scaffolding an app or viewer that you can integrate in your own products or websites!
About yFiles: The graph visualization SDK
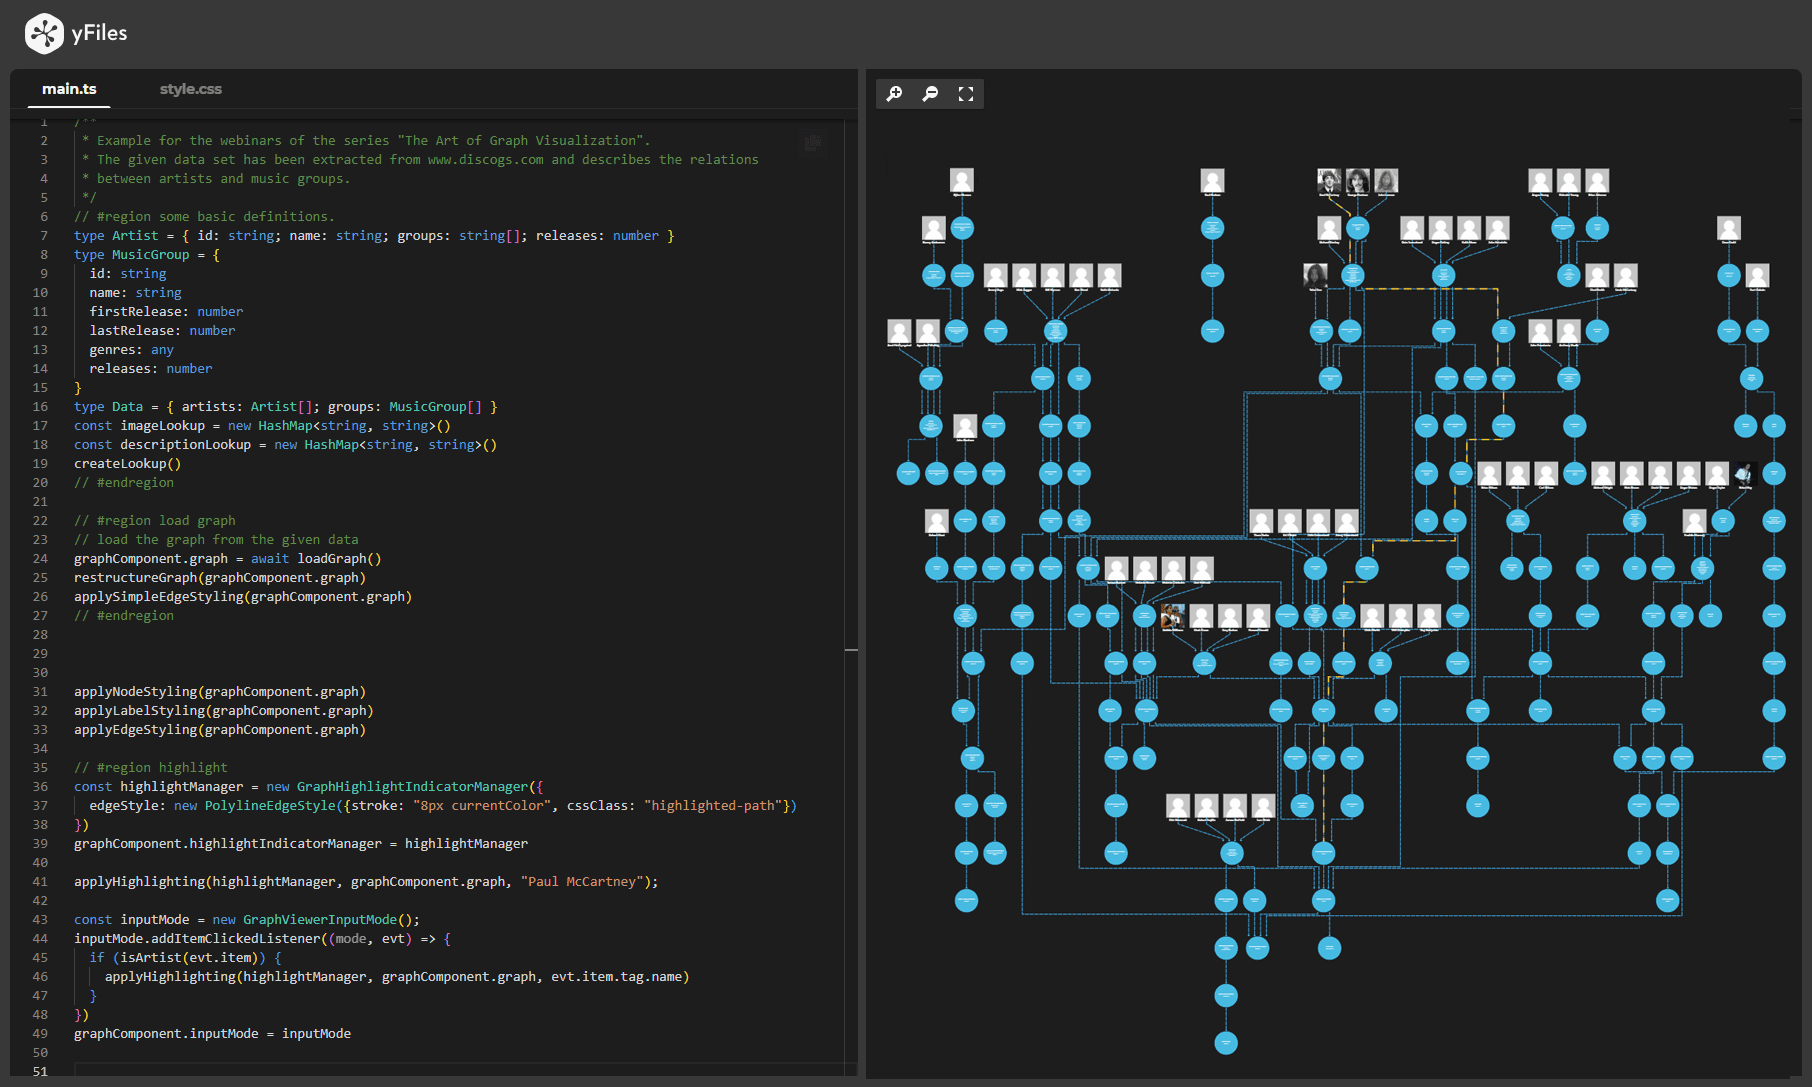
yFiles is your go-to SDK for crafting advanced graph visualizations, whether you're working with Web, Java, or .NET technologies. Its unmatched flexibility and scalability enable you to convert complex data into clear, actionable visuals, fitting for both enterprise and startup needs.
With yFiles, you're equipped for the future—supporting any data source while maintaining strong data security. Getting started is seamless, thanks to over 300 source-code demos, thorough documentation, and direct access to core developer support. These resources are available even during your free trial.
Backed by 25 years of graph drawing expertise, yFiles is trusted by top companies worldwide for their most critical visualization tasks.
Discover yFiles11 reasons why Neo4j developers trust yFiles!

yFiles Newsletter
Stay informed about yFiles, network visualization, and graph technology updates.
Join our newsletterVisualizing Neo4j query results in Jupyter Notebooks

If you are working with Neo4j graph data as a data scientist with Jupyter Notebooks or Jupyter Labs, consider giving this free visualization plugin a try. yFiles Graphs for Jupyter is a generic graph visualization plugin that can be installed in Jupyter Notebooks to visualize graph data. It comes with support for Neo4j graph data structures and is the quickest way for data scientists to get started with graph visualization in Jupyter.
Example source code
If you want to start coding right away, yFiles for HTML comes with a Neo4j Integration Demo. This example loads a small dataset from a Neo4j database. Starting from this, users can, for example, investigate the properties of the current nodes and edges, interactively expand adjacent parts of the graph, and switch to a different dataset by entering a custom Cypher query.
The source code of the Neo4j Integration Demo is available on the yWorks GitHub repository and part of the yFiles for HTML package.
Visualize a Neo4j database in your own application
Test yFiles' powerful diagramming component with a fully-functional trial package of yFiles for HTML.
To visualize your own Neo4j database with yFiles for HTML in your own application, start with the Neo4j Integration Demo that is part of the yFiles for HTML package or use any of the above techniques to get started.
- Download the trial version of yFiles for HTML at the yWorks Customer Center.
- Navigate to the source directory of the Neo4j Integration Sample Application.
- Explore the sample application's features or scaffold your own with the app generator
- adjust the source code to match your requirements or
- add to your app the many features shown in our Source Code Demos
Webinars: Visualizing Neo4j database contents with yFiles
You can find a number of free webinar recordings around the topics of Neo4j graph database visualization with yFiles for HTML on our webinars page.
More information is also available in our blogs posts about Neo4j. Check them out!


