Visualizing Knowledge Graphs: A Comprehensive GuideTransforming Data into Meaningful Insights
Welcome! This guide will show you how to create powerful knowledge graph visualizations. Because great graph visualizations aren't just aesthetically pleasing, they're meaningful, useful, and they definitely should be able to answer specific questions about your data.

What is knowledge graph visualization?
Knowledge graph visualization is the process of representing complex networks of interconnected information as visual diagrams where entities become nodes (circles, rectangles, or shapes) and relationships become edges (lines or arrows connecting nodes).
This transforms abstract data into intuitive visual patterns that reveal connections, hierarchies, clusters, and insights that would be invisible in raw data.
Effective knowledge graph visualization requires matching your data structure (trees, hierarchies, networks) with the right layout algorithm (hierarchic, organic, circular) and using visual encoding (color, size, shape) to communicate meaning instantly.

- Nodes represent entities (people, concepts, documents)
- Edges show relationships (citations, dependencies, associations)
- Layout algorithms organize structure for clarity
- Visual styling encodes additional data dimensions
What makes knowledge graphs special?
- Typed, directed edges (predicates) with labels; multiple parallel edges between the same entities are common.
- Schema vs. instance: Ontologies (classes, properties, constraints) differ from the data graph (instances).
- Reification/qualifiers: Model provenance, confidence, time validity, or sources on statements.
- Multilingual labels and aliases: Prefer readable labels over IRIs/IDs at render time.
- N-ary relations: Sometimes relations are better modeled as nodes (events/transactions) than plain edges.
Schema vs. instance graphs
The ontology/schema (classes, properties, constraints) calls for layered or tree-like layouts and compact legend-driven styling. Instance graphs focus on entity relationships and exploration; choose organic or radial layouts and prioritize filters and progressive disclosure.
We´d love to help you. Reach out and we'll get in touch with you.
Your message has been sent.
Real-world knowledge graph applications
Typical KG scenarios include enterprise search and discovery, product catalogs and BOMs, fraud rings, biomedical ontologies, scientific literature graphs, and customer 360. Each benefits from typed predicates, schema-aware layouts, predicate filters, and progressive disclosure.
The 5-step knowledge graph process

1. Problem settingDefine KG-specific questions and scope
Before you design anything, define the knowledge-graph question your visualization needs to answer. For example:
- "Which predicates connect Customer A to Entity B within 2 hops, and what are the sources and confidence values?"
- "Which classes or properties in our ontology are orphaned or overly broad?"
- "Show all part-of and subClassOf relations for Product P, highlight cycles and missing links."
- "Which documents assert (X interacts-with Y) during 2024, and from which data source do they come?"
- "How did the neighborhood of Entity E change over time (valid-from/to)?"
Having a clear question ensures your visualization is both meaningful and actionable.
Next, define domain standards and representation choices specific to knowledge graphs. For example:
- "Which ontologies/vocabularies (RDF/OWL, SKOS, schema.org, domain ontologies) do we follow, and how do we present labels vs. IRIs?"
- "How are predicates displayed: prefix-abbreviations, human-readable labels, and a legend for long IRIs?"
- "How do we surface qualifiers/provenance (source, confidence, time validity): edge badges, tooltips, side panels?"
- "Schema vs. instance: separate views or mixed? Distinct styles for classes vs. instances?"
- "How to handle direction, parallel edges, and n-ary relations (as edges vs. event/statement nodes)?"
Next, consider the deployment context for knowledge graphs:
- "Live backend integration (SPARQL/Cypher/Gremlin) for expand-on-demand and predicate/class filters?"
- "Localization and multilingual labels (user locale, fallbacks, aliases)?"
- "Access control/PII masking and audit requirements for sensitive entities and statements?"
- "Scale and performance: expected node/edge counts, level-of-detail, paging/tiling, export needs (PNG/SVG/PDF)?"
Define the scope early to avoid scope creep:
- In-scope entity types and predicates (with a legend)
- Time window and versions (current vs. historical)
- Max hop depth and expansion rules
- Primary success metrics (e.g., time-to-path, clicks-to-insight)
2. Data analysis Understand your data-structure
Before choosing layouts or styling, examine your data and its underlying structure to make informed visualization decisions. This analysis reveals which yFiles features and layouts will work best for your specific dataset. Consider the following:
- Components: Are you dealing with a single large network or multiple clusters?
- Structure: Is the data hierarchical, cyclic, or a mix?
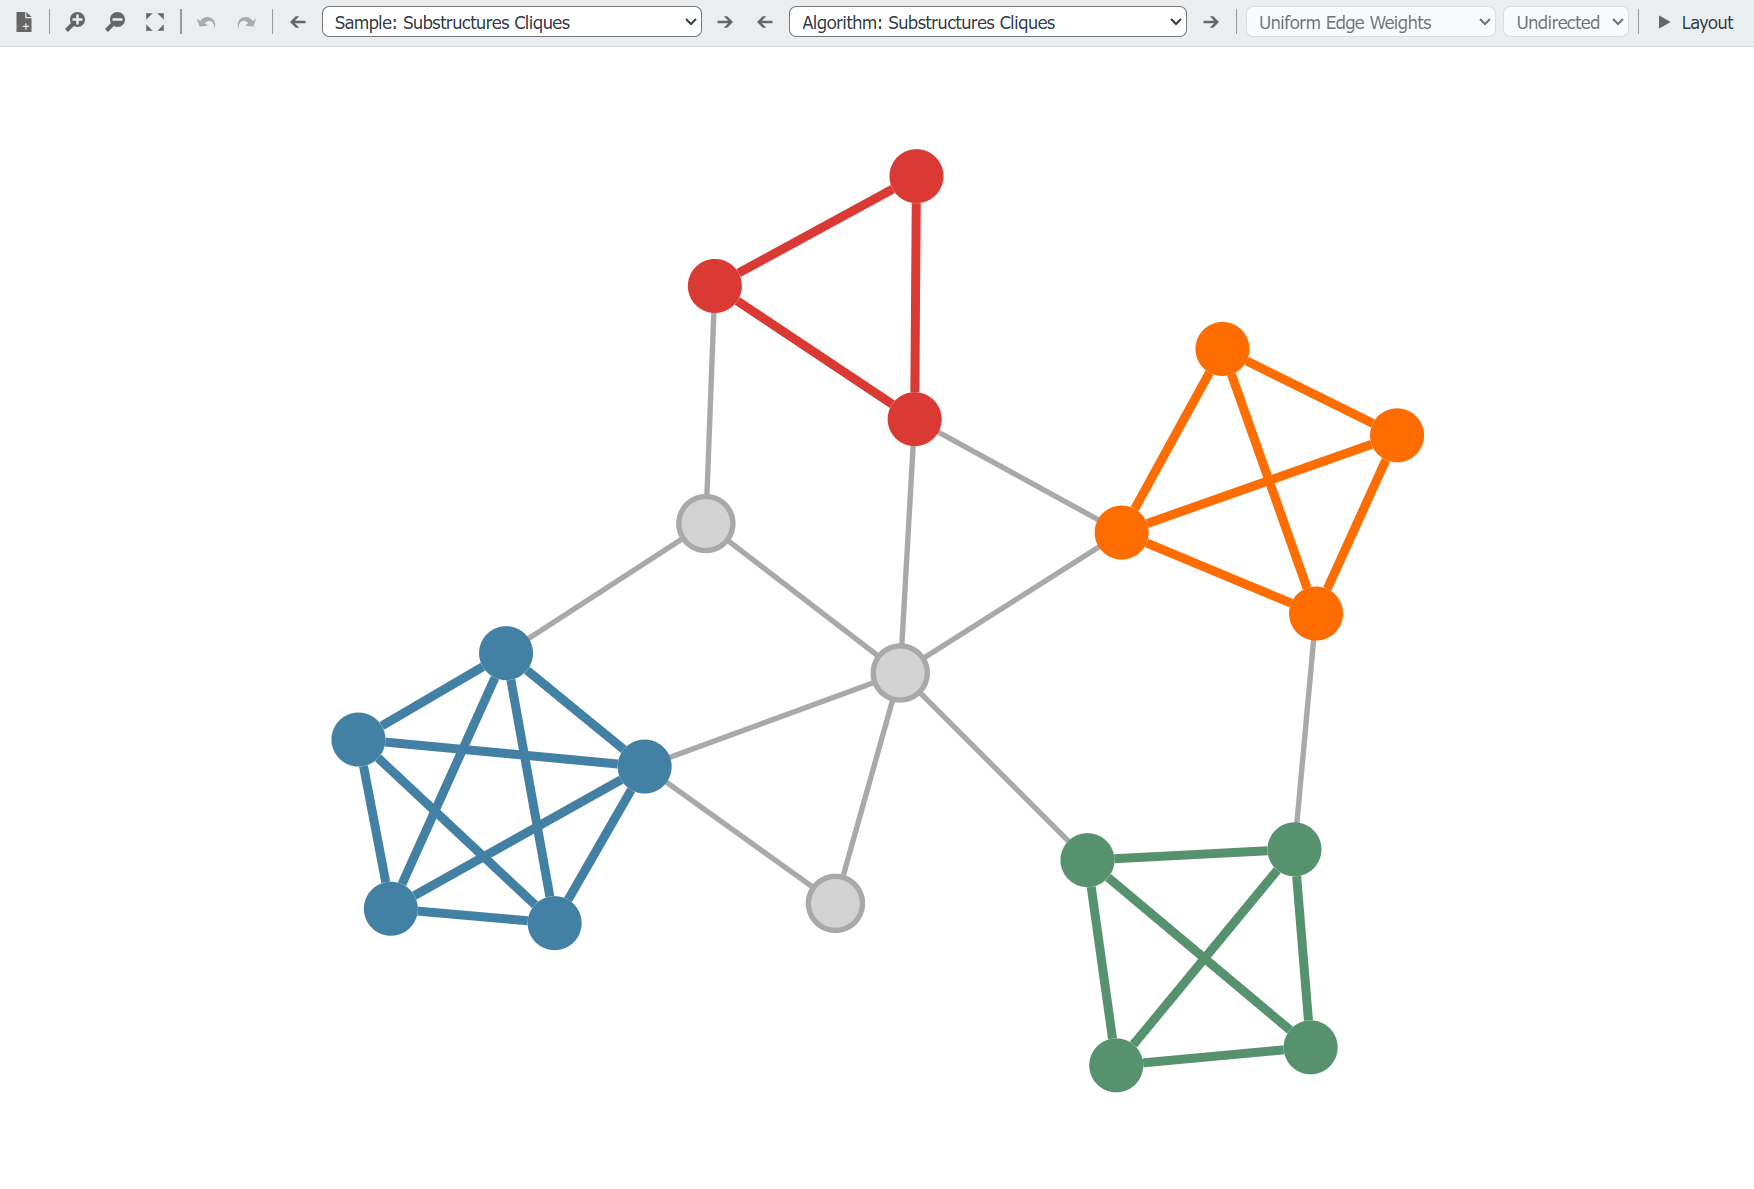
- Clusters: Identify densely connected groups.
- Centrality: Determine which elements are most influential or connected.
- Basic metrics: Node count, max degree, and density.
For knowledge graphs, consider predicate-aware analysis:
- Compute centrality by edge type (predicate-specific degree or weighted measures).
- Extract subgraphs by class/type or property constraints (schema-driven subgraphing).
- Identify communities per predicate family or within ontology branches.
- Path queries that respect direction and predicate sets
(e.g., only rdfs:subClassOf paths). - Compare metrics on schema graph vs. instance graph.
Integrate your backend queries directly:
- SPARQL (RDF/OWL stores): load-on-demand neighbors, filters by predicate/class, time validity.
- Cypher/Gremlin (property graphs): expand ego-nets, typed filters, incremental updates for interaction.
Mapping your data thoughtfully to nodes, edges, and nested group nodes will help express hierarchy and relationships visually. Experimenting conceptually with which elements become nodes versus edges and considering potential layouts will give you a better understanding of the patterns in your data before creating the graph.
yFiles graph analysis tools
yFiles provides a comprehensive set of graph analysis algorithms to help you understand and explore your data's structure:
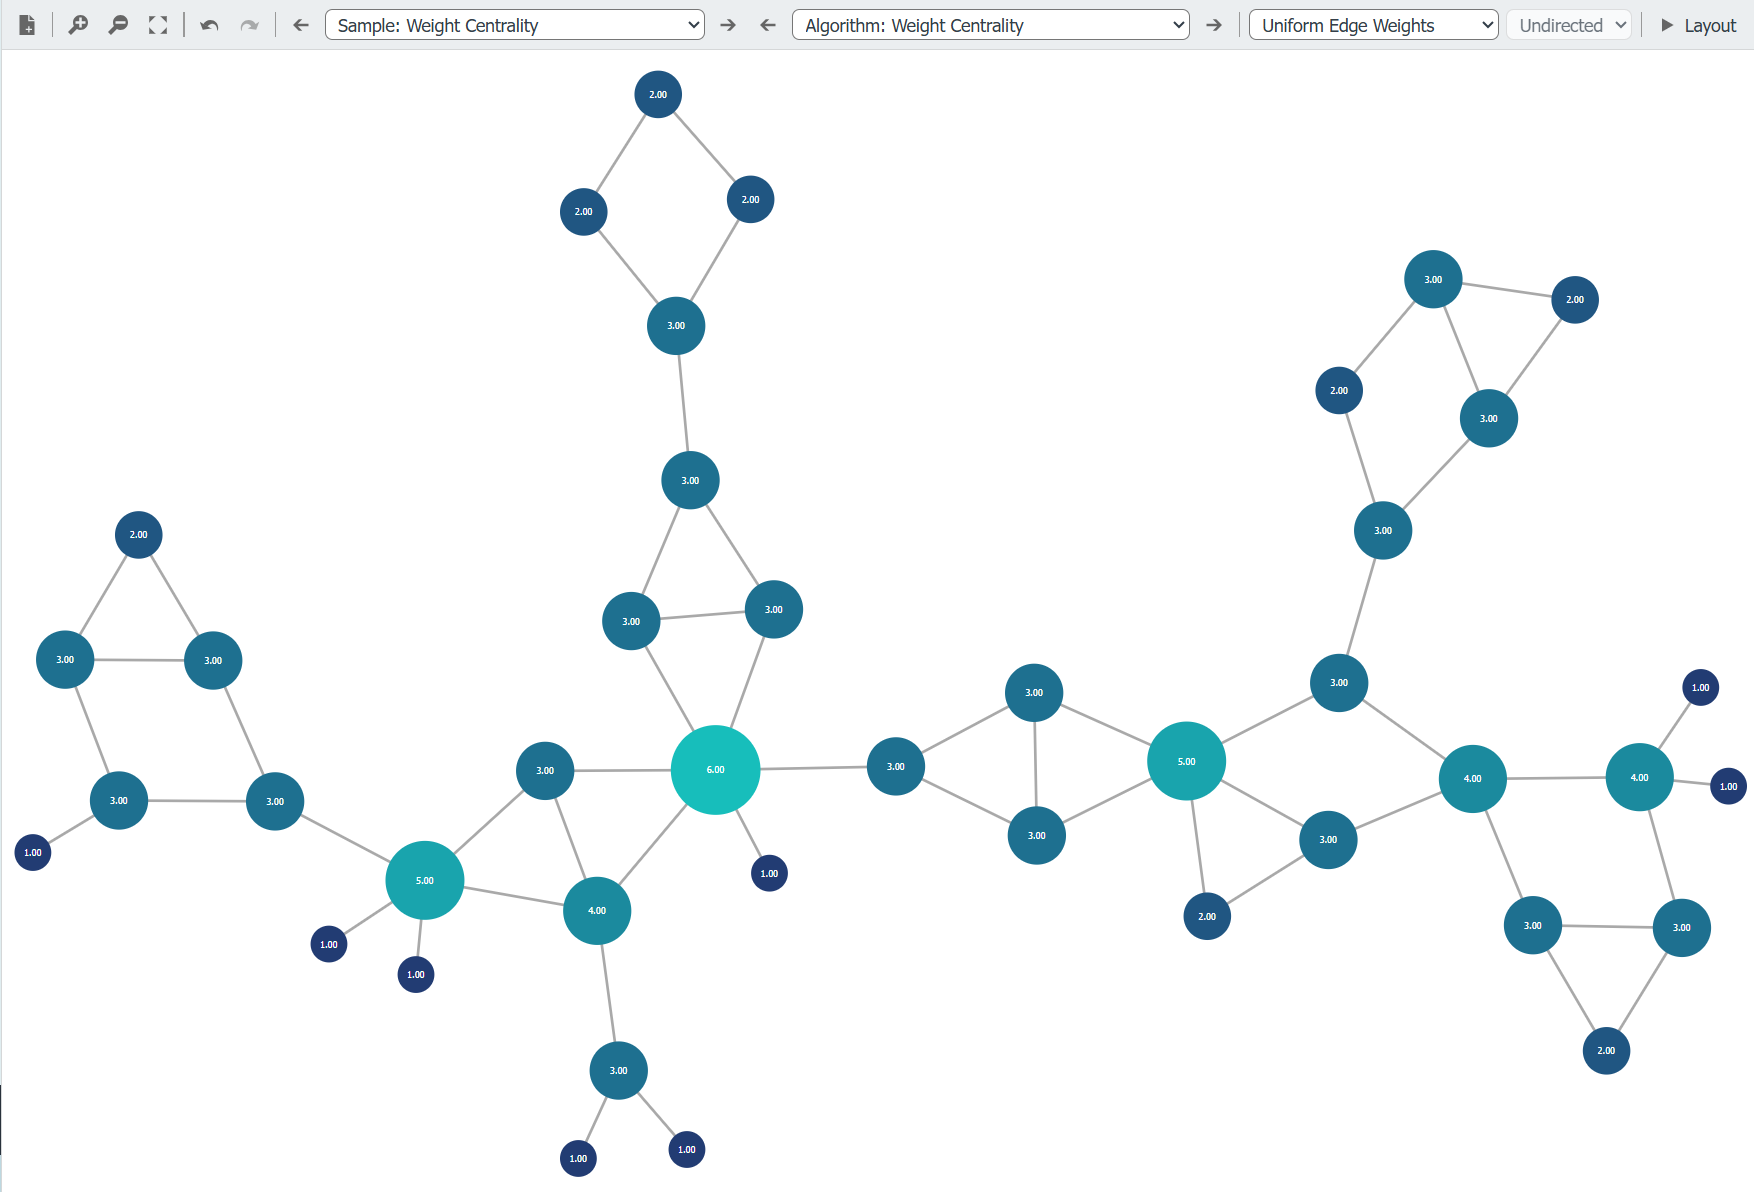
- Centrality measures: Identify the most influential nodes using algorithms like Betweenness Centrality.
- Pathfinding & reachability: Determine the shortest paths and assess connectivity between nodes.
- Clustering & community detection: Group nodes into clusters to uncover hidden relationships.
- Graph traversals: Explore the graph's structure through various traversal methods.
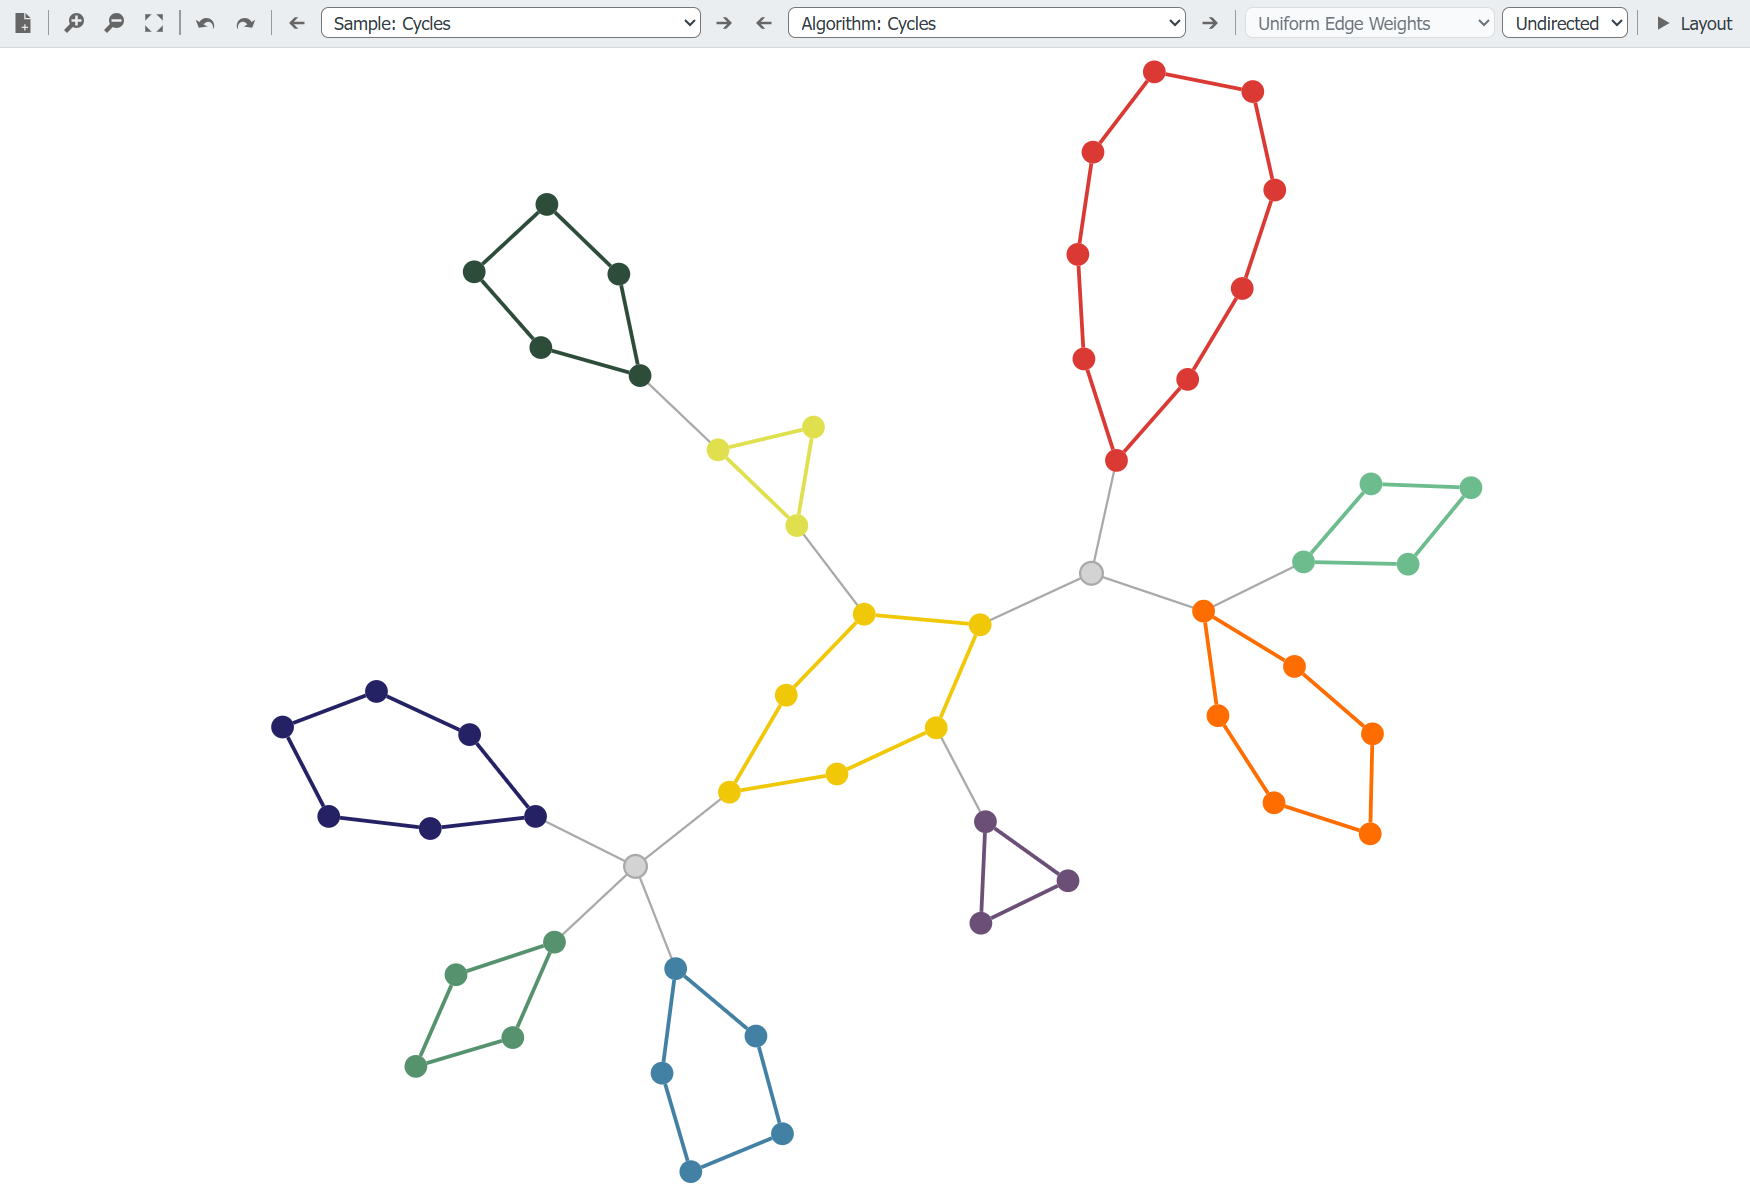
- Cycle detection & connectivity: Analyze the presence of cycles and assess the overall connectivity of the graph.
These algorithms are part of the yFiles Graph Analysis API. See the Graph Analysis developer guide for details.
Mapping data to visual structure
Your data can be represented as nodes, edges, or nested group nodes, using containment to visually express hierarchy. When your data is complex, experiment with:
- What should be a node versus an edge, sometimes relationships work better as entities.
- Different layouts to reveal patterns.
- Identifying clusters and understanding how they relate to other data attributes.
- Determining which nodes are most central versus most influential, as these are not always the same.
This hands-on experimentation gives you a deeper understanding of your data’s structure and informs your visualization approach before committing to a specific design.
3. LayoutChoose the right algorithm
Your layout algorithm should match your data's inherent structure and the questions you're trying to answer. The right layout makes patterns immediately visible, while the wrong one creates confusion.
Match layout to your data structure and goals:
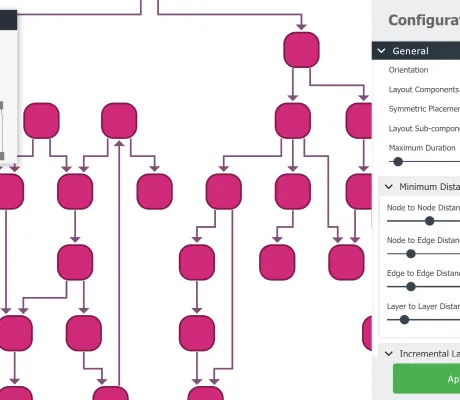
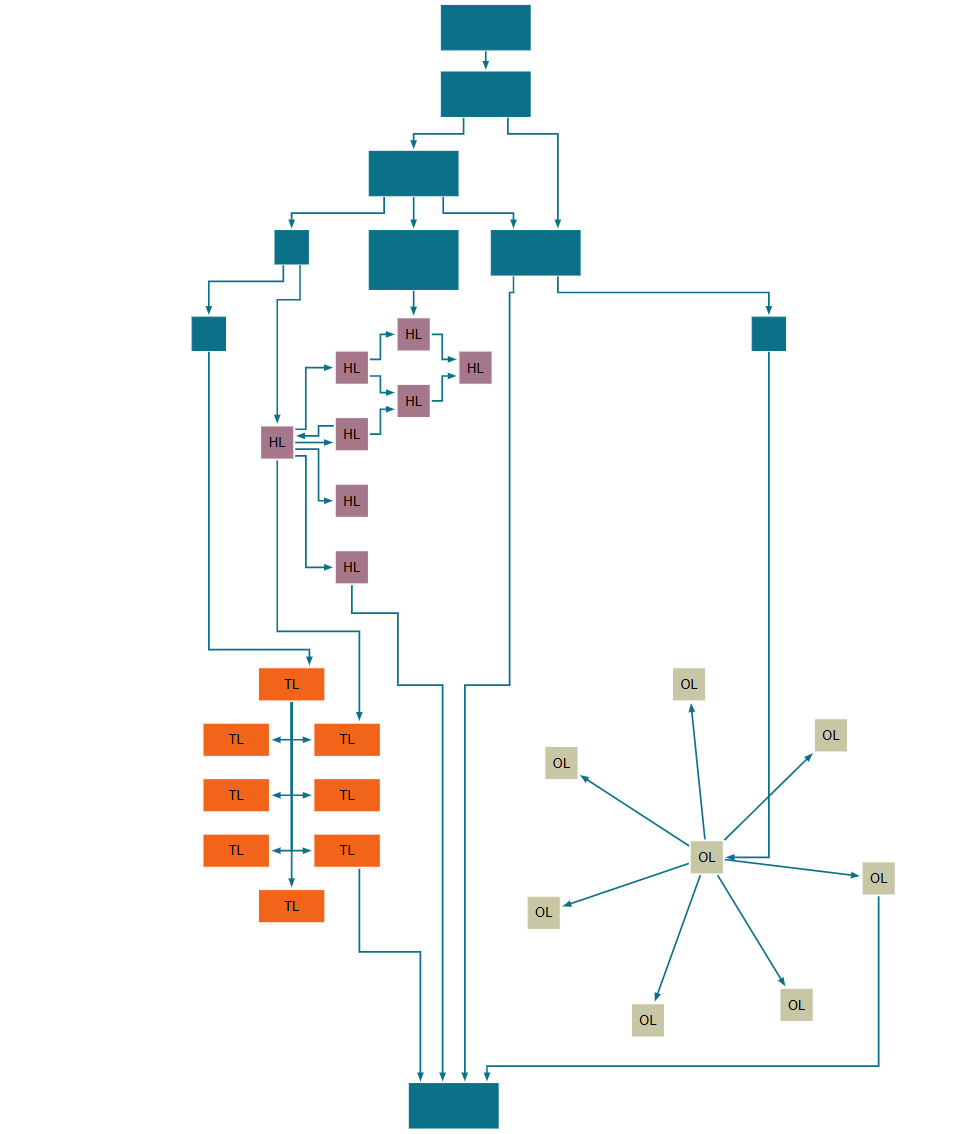
- Ontologies Hierarchic layout for rdfs:subClassOf / part-of; group by namespace or module.
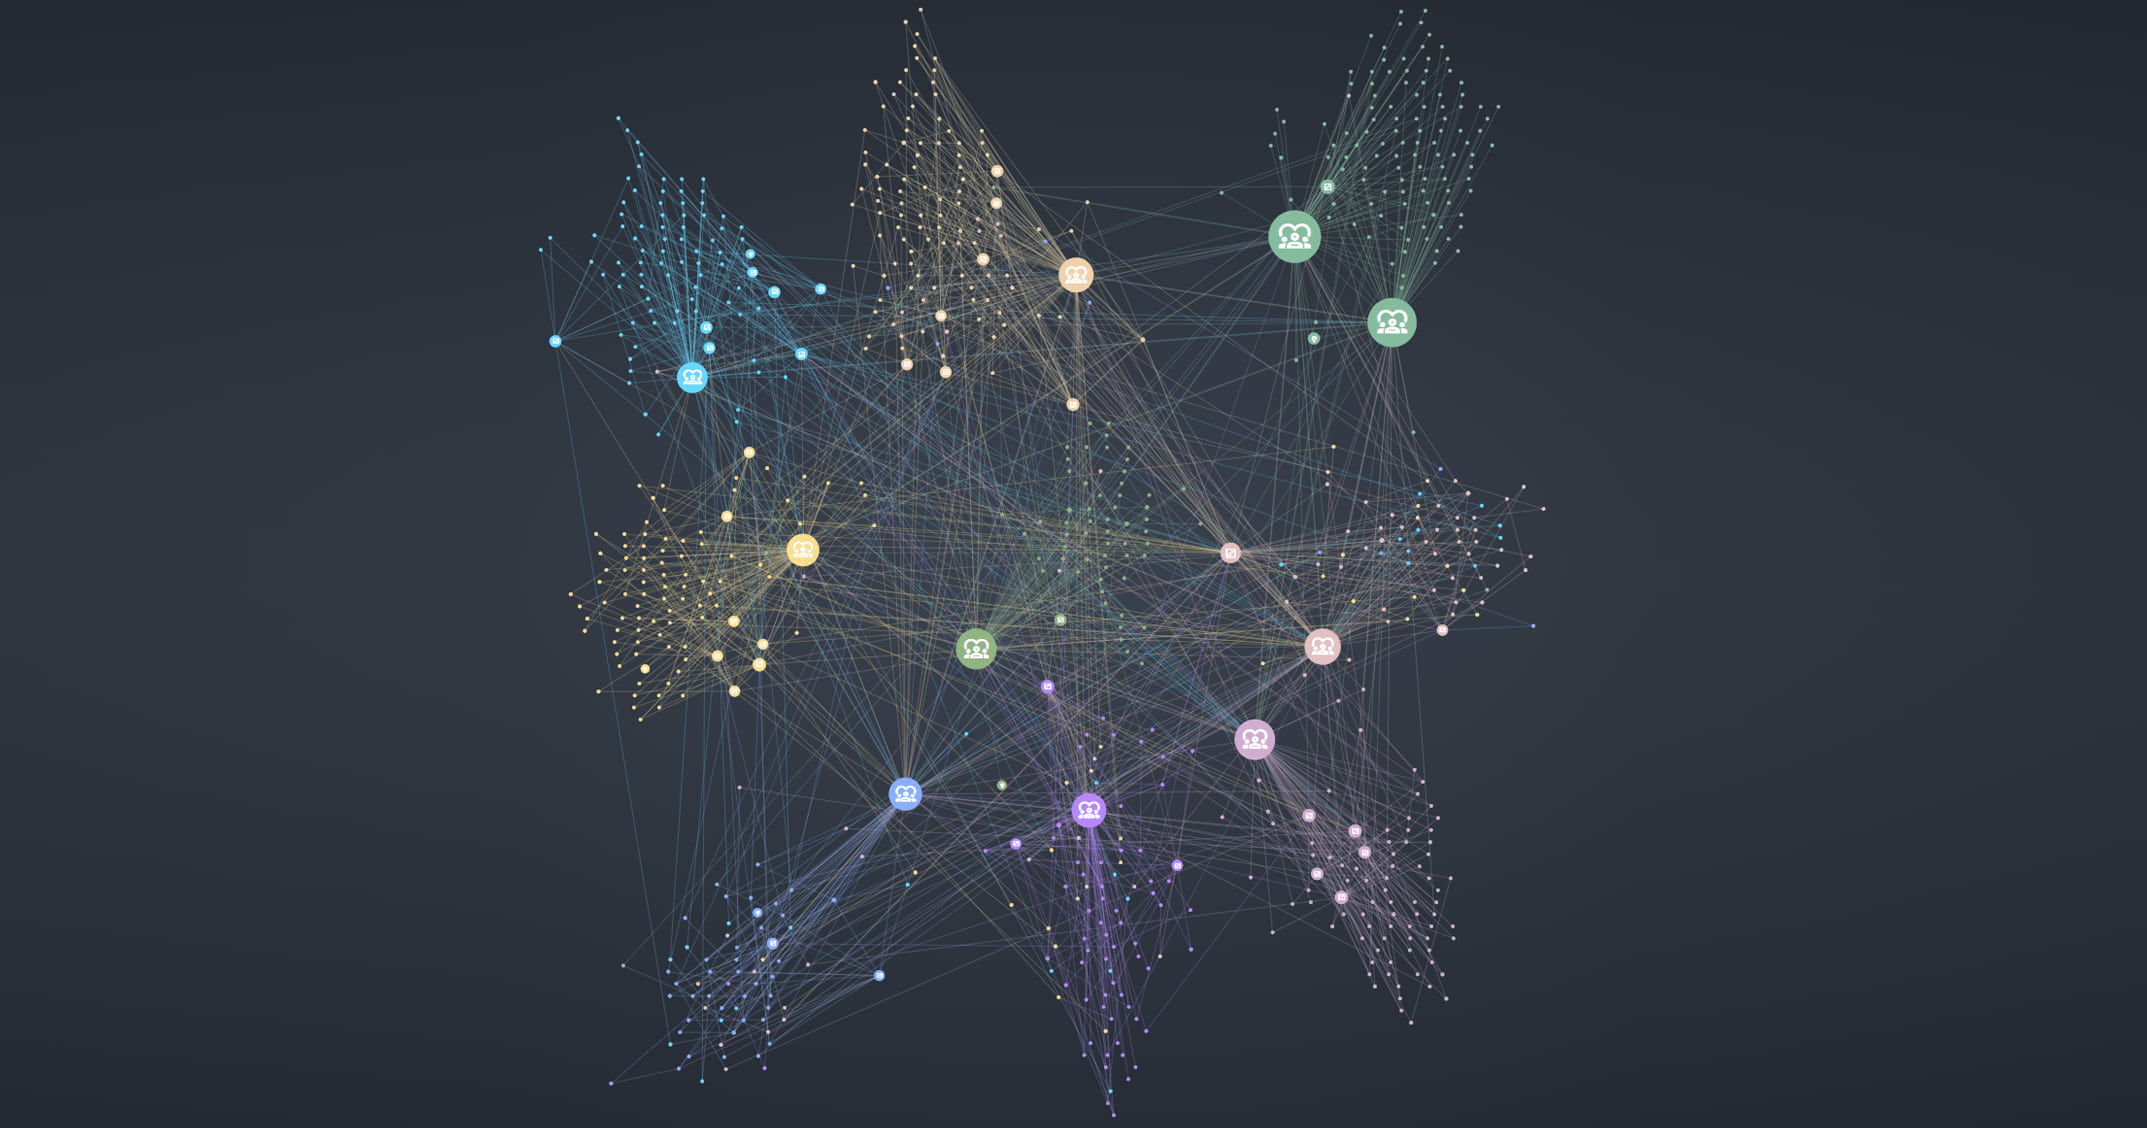
- Entity–relation exploration Organic layout with edge bundling; color edges by predicate.
- Ego-centric analysis Radial layout around a focal entity, progressively disclose neighbors by predicate.
- Schema vs. instance Use tree/hierarchic for schema; organic/radial/circular for instances/clusters.
yFiles offers a variety of different layout algorithms. These include, for example:
- Hierarchical Perfect for DAGs and temporal flows (knowledge ontologies).
- Organic Natural for exploring unknown structures (entity relationships).
- Circular Great for showing clusters and communities.
- Tree Ideal for pure hierarchies (taxonomies).
- Radial Focus on one central entity and its connections.
4. StylingEncode information visually
Once you've explored your data structure and chosen a layout, styling becomes your tool for encoding additional information visually. Use edge direction, thickness, and color to show relationships and their strength.
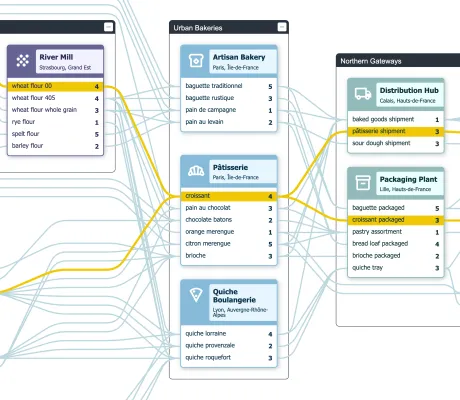
Expand or collapse group nodes to control information density. Style nodes with colors, sizes, shapes, and even interactive HTML controls (like avatars, status indicators, or embedded data fields) to communicate attributes beyond basic structure.
Labels add context where needed. The goal is layering meaning onto your graph's skeleton, every visual choice should answer a question or highlight a pattern your analysis revealed.
In knowledge graphs, visual encodings map semantics:
- Color nodes by class/type; color edges by predicate family.
- Show edge labels (predicates) consistently; use abbreviations/legends for long IRIs.
- Use badges for qualifiers (e.g., confidence, validity interval, source).
- Display language tags (en, de, fr) on demand; default to user locale.
- Use parallel edges rendering and bundling to keep multi-relational pairs readable.
Styling isn't just aesthetics, it's information encoding:
Color
Categories, highlighting, clusters

Shape
Entity types, semantic meaning

Size
Importance, attributes, centrality

Edge weight
Relationship strength

Design principles
5. InteractionMake your knowledge graph explorable and useful
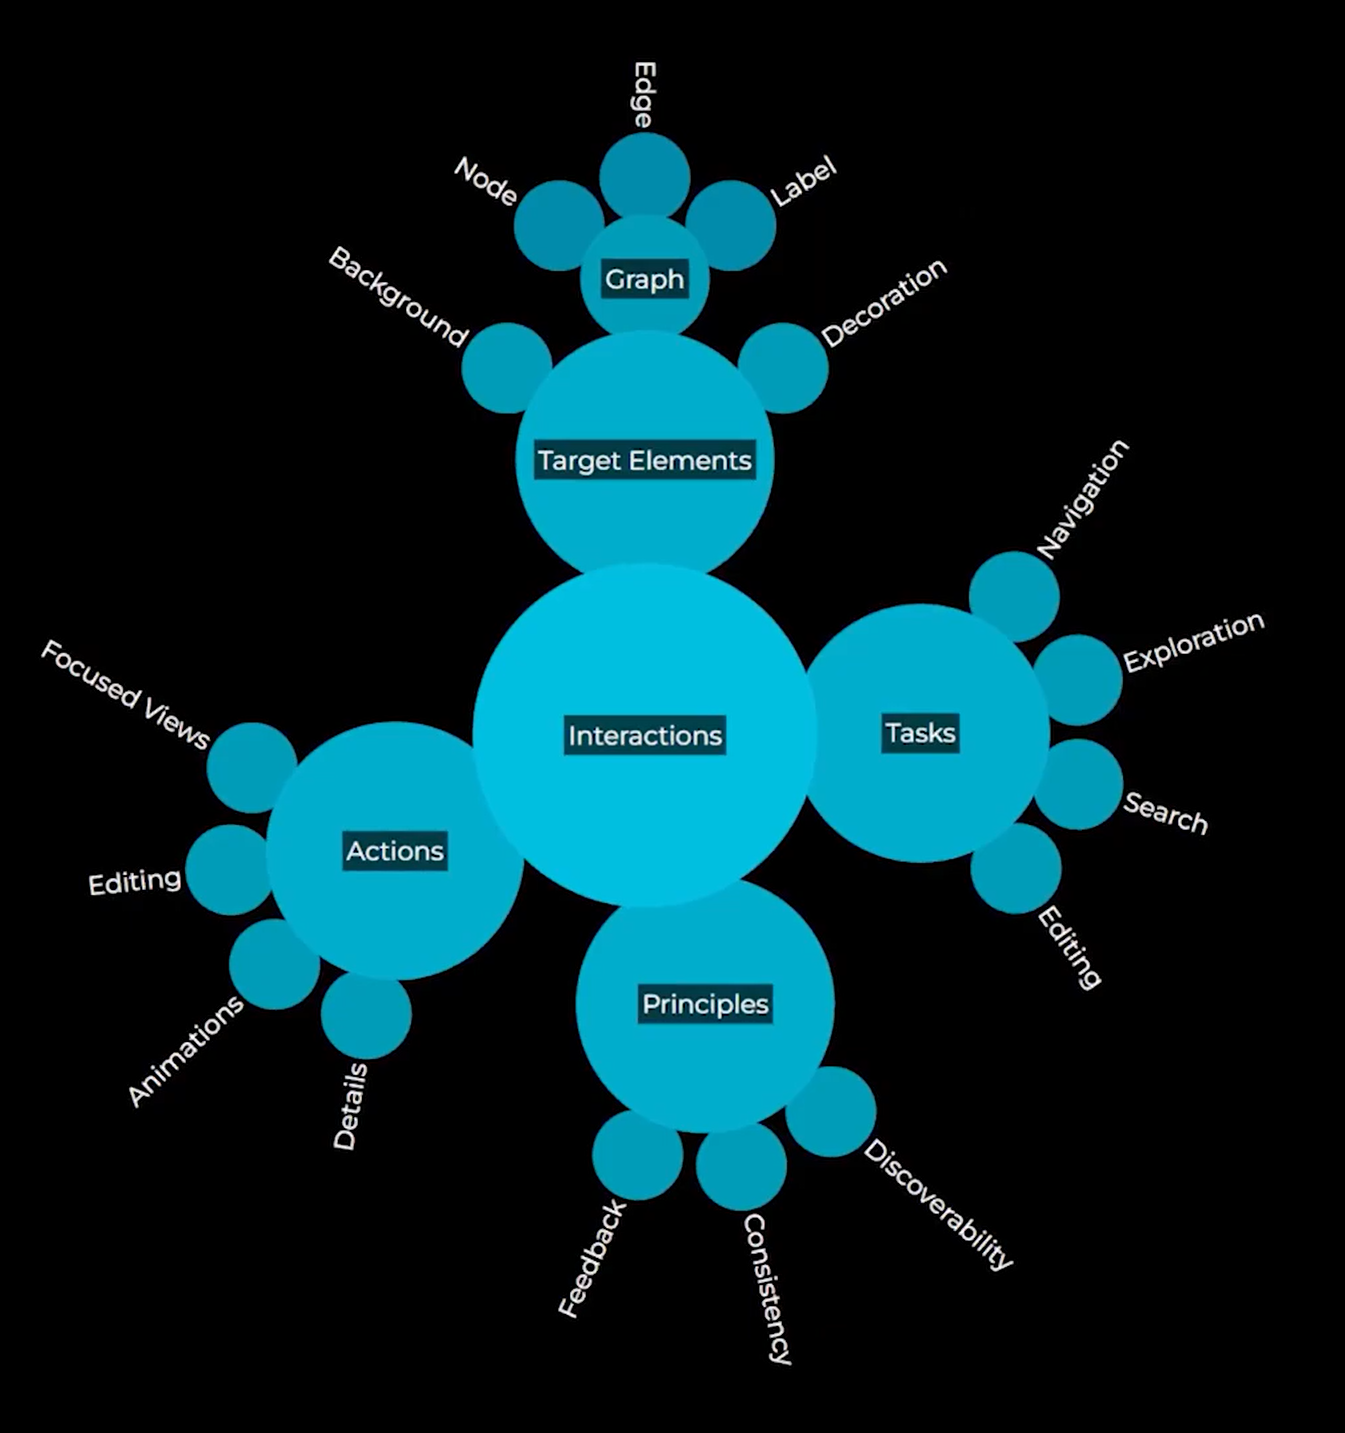
A knowledge graph becomes far more powerful when users can actively explore it. Consider incorporating these interaction techniques:
Highlighting
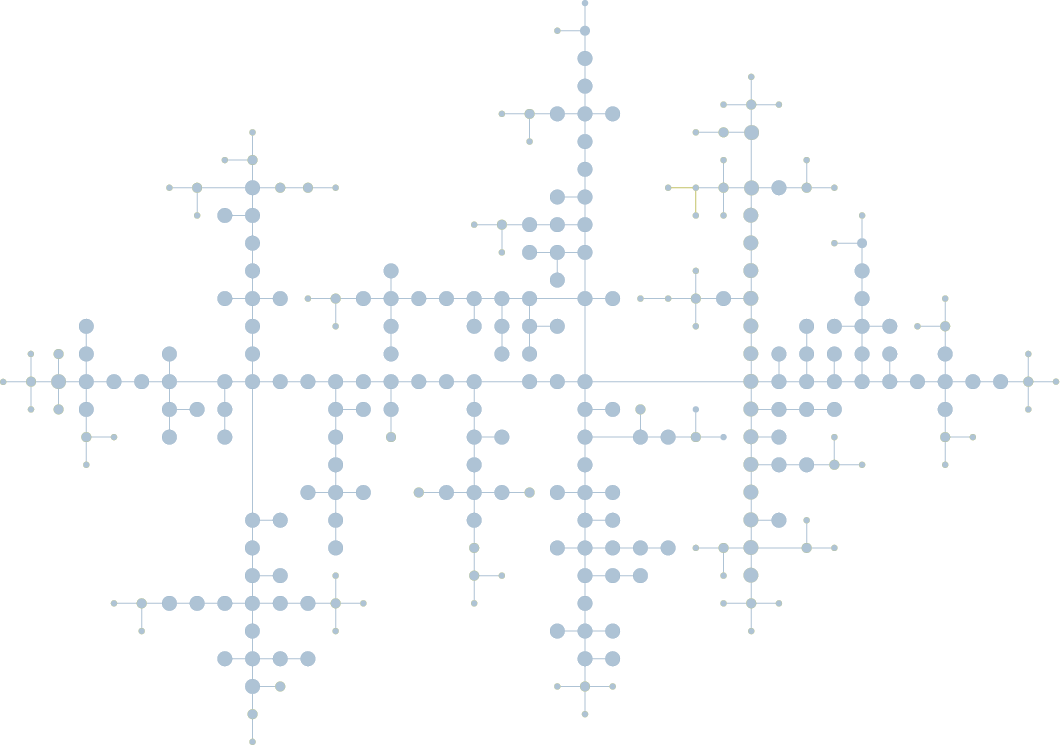
Draw attention to specific paths, relationships, or entities. This helps users quickly see relevant connections without being overwhelmed by the entire graph.
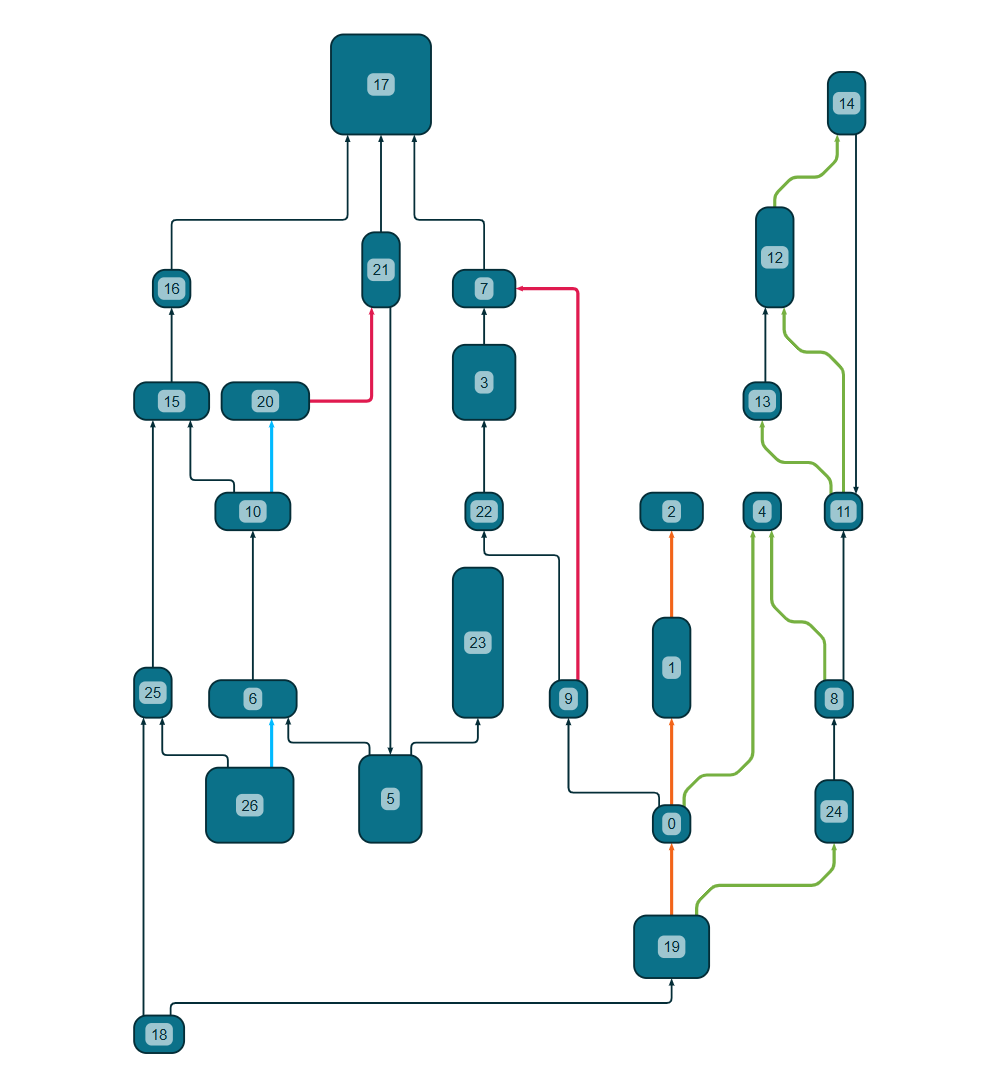
Filtering
Allow users to show or hide nodes and edges based on criteria like type, predicate-/class-filter, importance, or date. Filters help users focus on exactly what matters.
Filtering functionality
Progressive disclosure
Start with a simplified view and reveal additional details on demand. Expand-on-demand via SPARQL/Cypher.This keeps the graph readable while still offering depth.
Level of detail
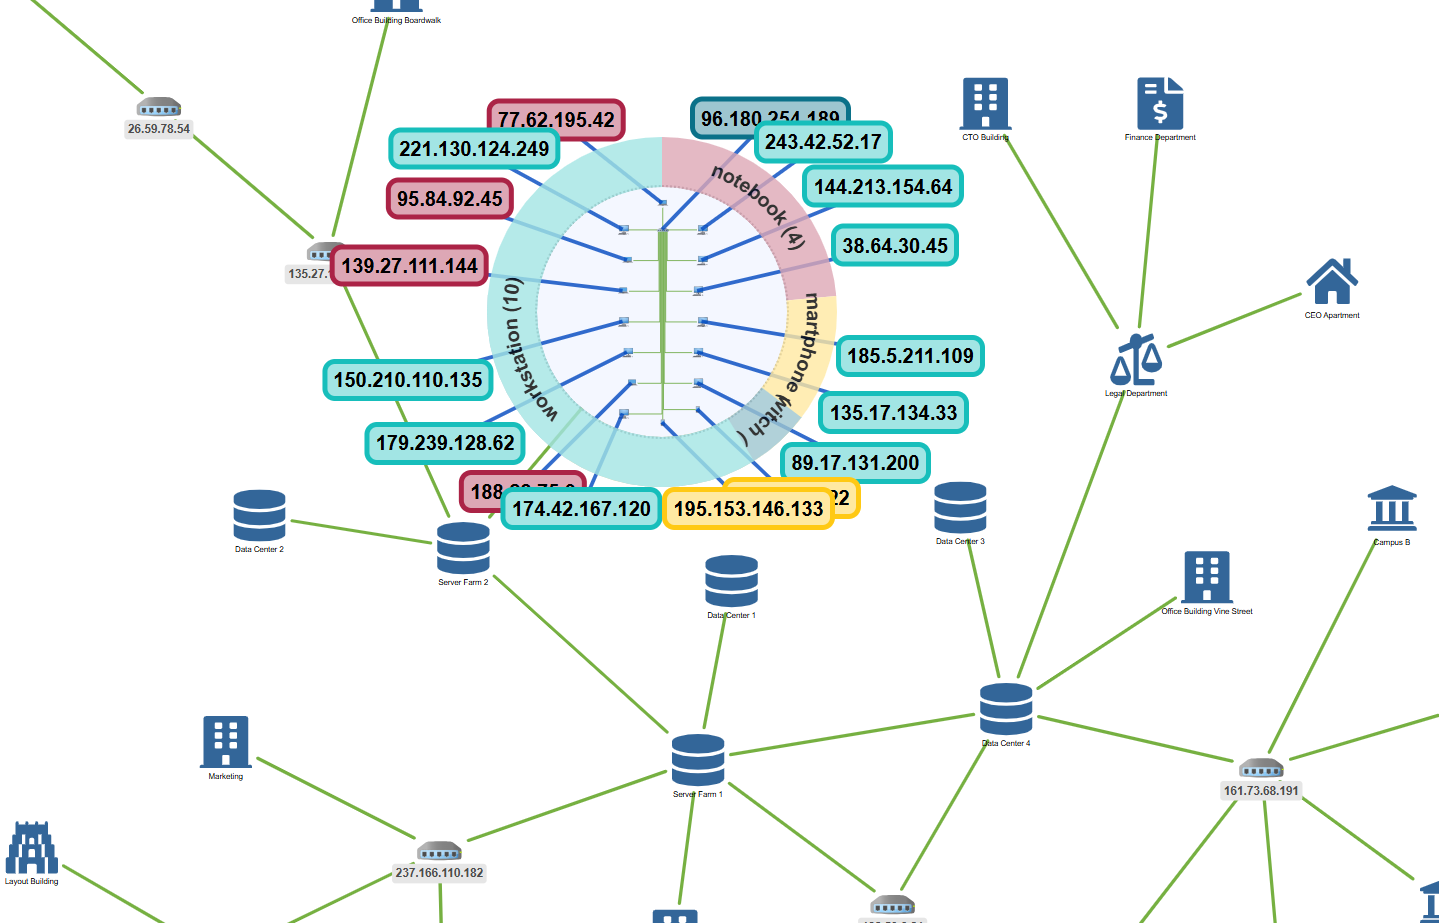
Lens tools
Provide zooming or “focus+context” tools to inspect specific areas without losing the overall context of the network.
Editing & annotations
Allow optional curation workflows: add/flag entities, annotate statements with provenance or confidence. Keep editing separate from exploration if your KG is authoritative.
Interactive diagram interaction
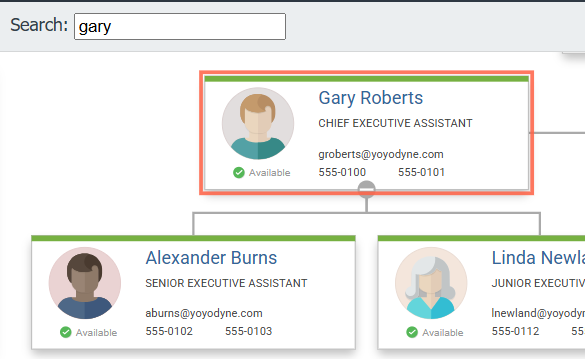
Search & navigation
Enable entity lookup, predicate filters, and neighborhood expansion (e.g., “show only part-of and interacts-with within 2 hops”).
Search functionality
Interactive feedback
Show tooltips, contextual menus, or dynamic summaries when users hover or click elements, giving immediate insight without cluttering the visualization.

Context menu
The goal is to make interactions intuitive so users can explore the network, discover insights, and answer their specific questions efficiently.
Pro tips
- Start small: Test with 50-100 nodes before scaling to thousands.
- Use real data early: Work with actual samples to discover data quirks.
- Sketch first: Use yEd Live or paper before writing code.
- Learn from others: Search for similar visualizations in your domain.
- Iterate: Revisit problem setting as you learn about your data.
- Any data format works: JSON, XML, CSV, databases, SPARQL/Cypher, RDF—yFiles handles them all.
Frequently Asked Questions
Recap
Guide to creating knowledge graph visualizations
Knowledge graph visualization transforms complex networks of interconnected entities and relationships into intuitive diagrams that facilitate discovery, insight, and decision-making. By mapping nodes and edges to represent people, concepts, documents, and their associations, visual knowledge graphs reveal clusters, hierarchies, and hidden patterns that would remain obscure in raw data.
The yFiles SDK provides an advanced toolset for visualizing, analyzing, and interacting with knowledge graphs at any scale. Developers can exploit a suite of layout algorithms—such as hierarchical, organic, and radial—to adapt to every graph structure, while dynamic styles and rich interaction techniques turn data into actionable information. The yFiles platform also offers built-in graph analysis, live data binding, and support for incremental updates.
Practical implementation is guided by a five-step process, starting from defining analytical questions, understanding graph structure, selecting the right layout algorithm, incorporating meaningful visual encoding, and explorable and useful graph interaction. Best practices and industry use cases—including organizational charts, supply chains, research networks, and more—are covered in real-world applications, and pro tips.
Related content
Got questions about
visualizing knowledge graphs?

Sebastian Niedworok
Consulting
Email: hello@yworks.com
Phone: +49 7071 9709050
About yFiles: The graph visualization SDK
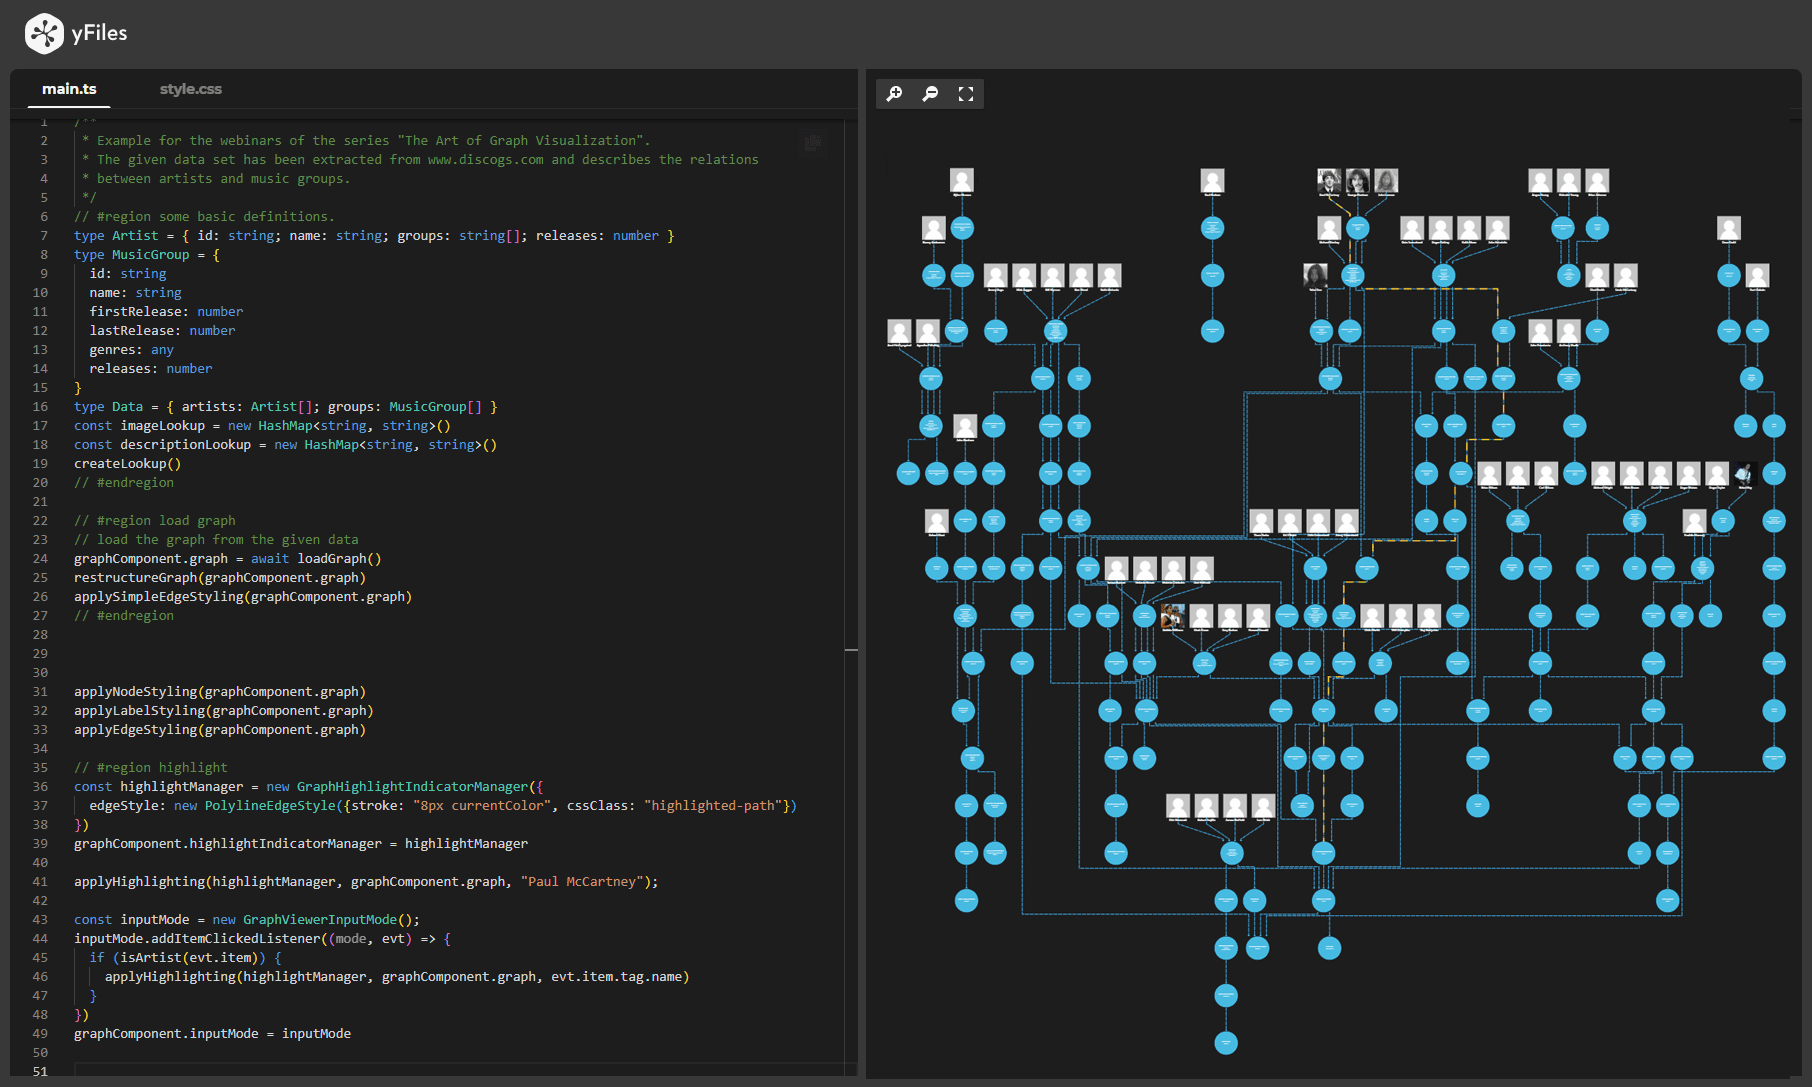
yFiles is your go-to SDK for crafting advanced graph visualizations, whether you're working with Web, Java, or .NET technologies. Its unmatched flexibility and scalability enable you to convert complex data into clear, actionable visuals, fitting for both enterprise and startup needs.
With yFiles, you're equipped for the future—supporting any data source while maintaining strong data security. Getting started is seamless, thanks to over 300 source-code demos, thorough documentation, and direct access to core developer support. These resources are available even during your free trial.
Backed by 25 years of graph drawing expertise, yFiles is trusted by top companies worldwide for their most critical visualization tasks.
Discover yFiles11 reasons why developers choose yFiles, the superior diagramming SDK

yFiles Newsletter
Stay informed about yFiles, network visualization, and graph technology updates.
Join our newsletter
