Vibe Coding
Building Network Visualizations with AI Webinar Recording - July 8, 2026
Building Network Visualizations with AI
AI tools are great at generating basic UI components. But when you need to build something complex like a network diagram or organizational chart, things get tricky. Standard AI models don't understand the architectural constraints and performance considerations that matter for enterprise visualizations.
This webinar explores practical approaches to AI-assisted development for visualization work. We cover the basics like prompting and IDE co-pilots, all the way up to autonomous agents with the new yFiles MCP Server. Along the way, you'll see where AI actually helps speed things up, where it struggles, and what approaches keep your codebase maintainable long-term.
Our CTO Sebastian walks through a real example of building an interactive diagram with AI, from the initial prompt all the way to polished code. We'll wrap up with live Q&A so you can ask your own questions.

Use this prompt and paste it into your agent to get started:

Thank you!
Your message has been sent.
We'll get back to you as soon as possible.
Key Takeaways from the Webinar
Generic AI Limitations
Standard LLMs struggle with complex graph visualizations. While they can generate typical UI components, they lack understanding of the subtle requirements needed for network diagrams and organizational charts.
Practical Techniques
From basic prompting and IDE co-pilots to autonomous agents—each approach has distinct advantages and tradeoffs depending on your use case.
Agenda: What's covered in this webinar
1. The Reality of AI-Assisted Development
Why generic AI tools hit their limits with complex visualizations. The key differences between standard UI generation and graph visualization requirements.
2. Comparing AI approaches
- Basic Prompting: Fast, but error-prone
- IDE Co-Pilots: Context-aware, but limited
- Autonomous Agents: Powerful, but requires good steerage
3. The yFiles MCP server approach
How domain-specific knowledge empowers AI to generate better solutions. Integration with modern AI frameworks.
4. Live demo: From prompt to production code
Step-by-step walkthrough of building and refining an interactive network diagram with AI assistance.
Watch the recorded webinar
See the full walkthrough of building an interactive diagram from scratch using AI.
This
session covers practical techniques, and real examples.
Visualize and analyze connected data for any use case
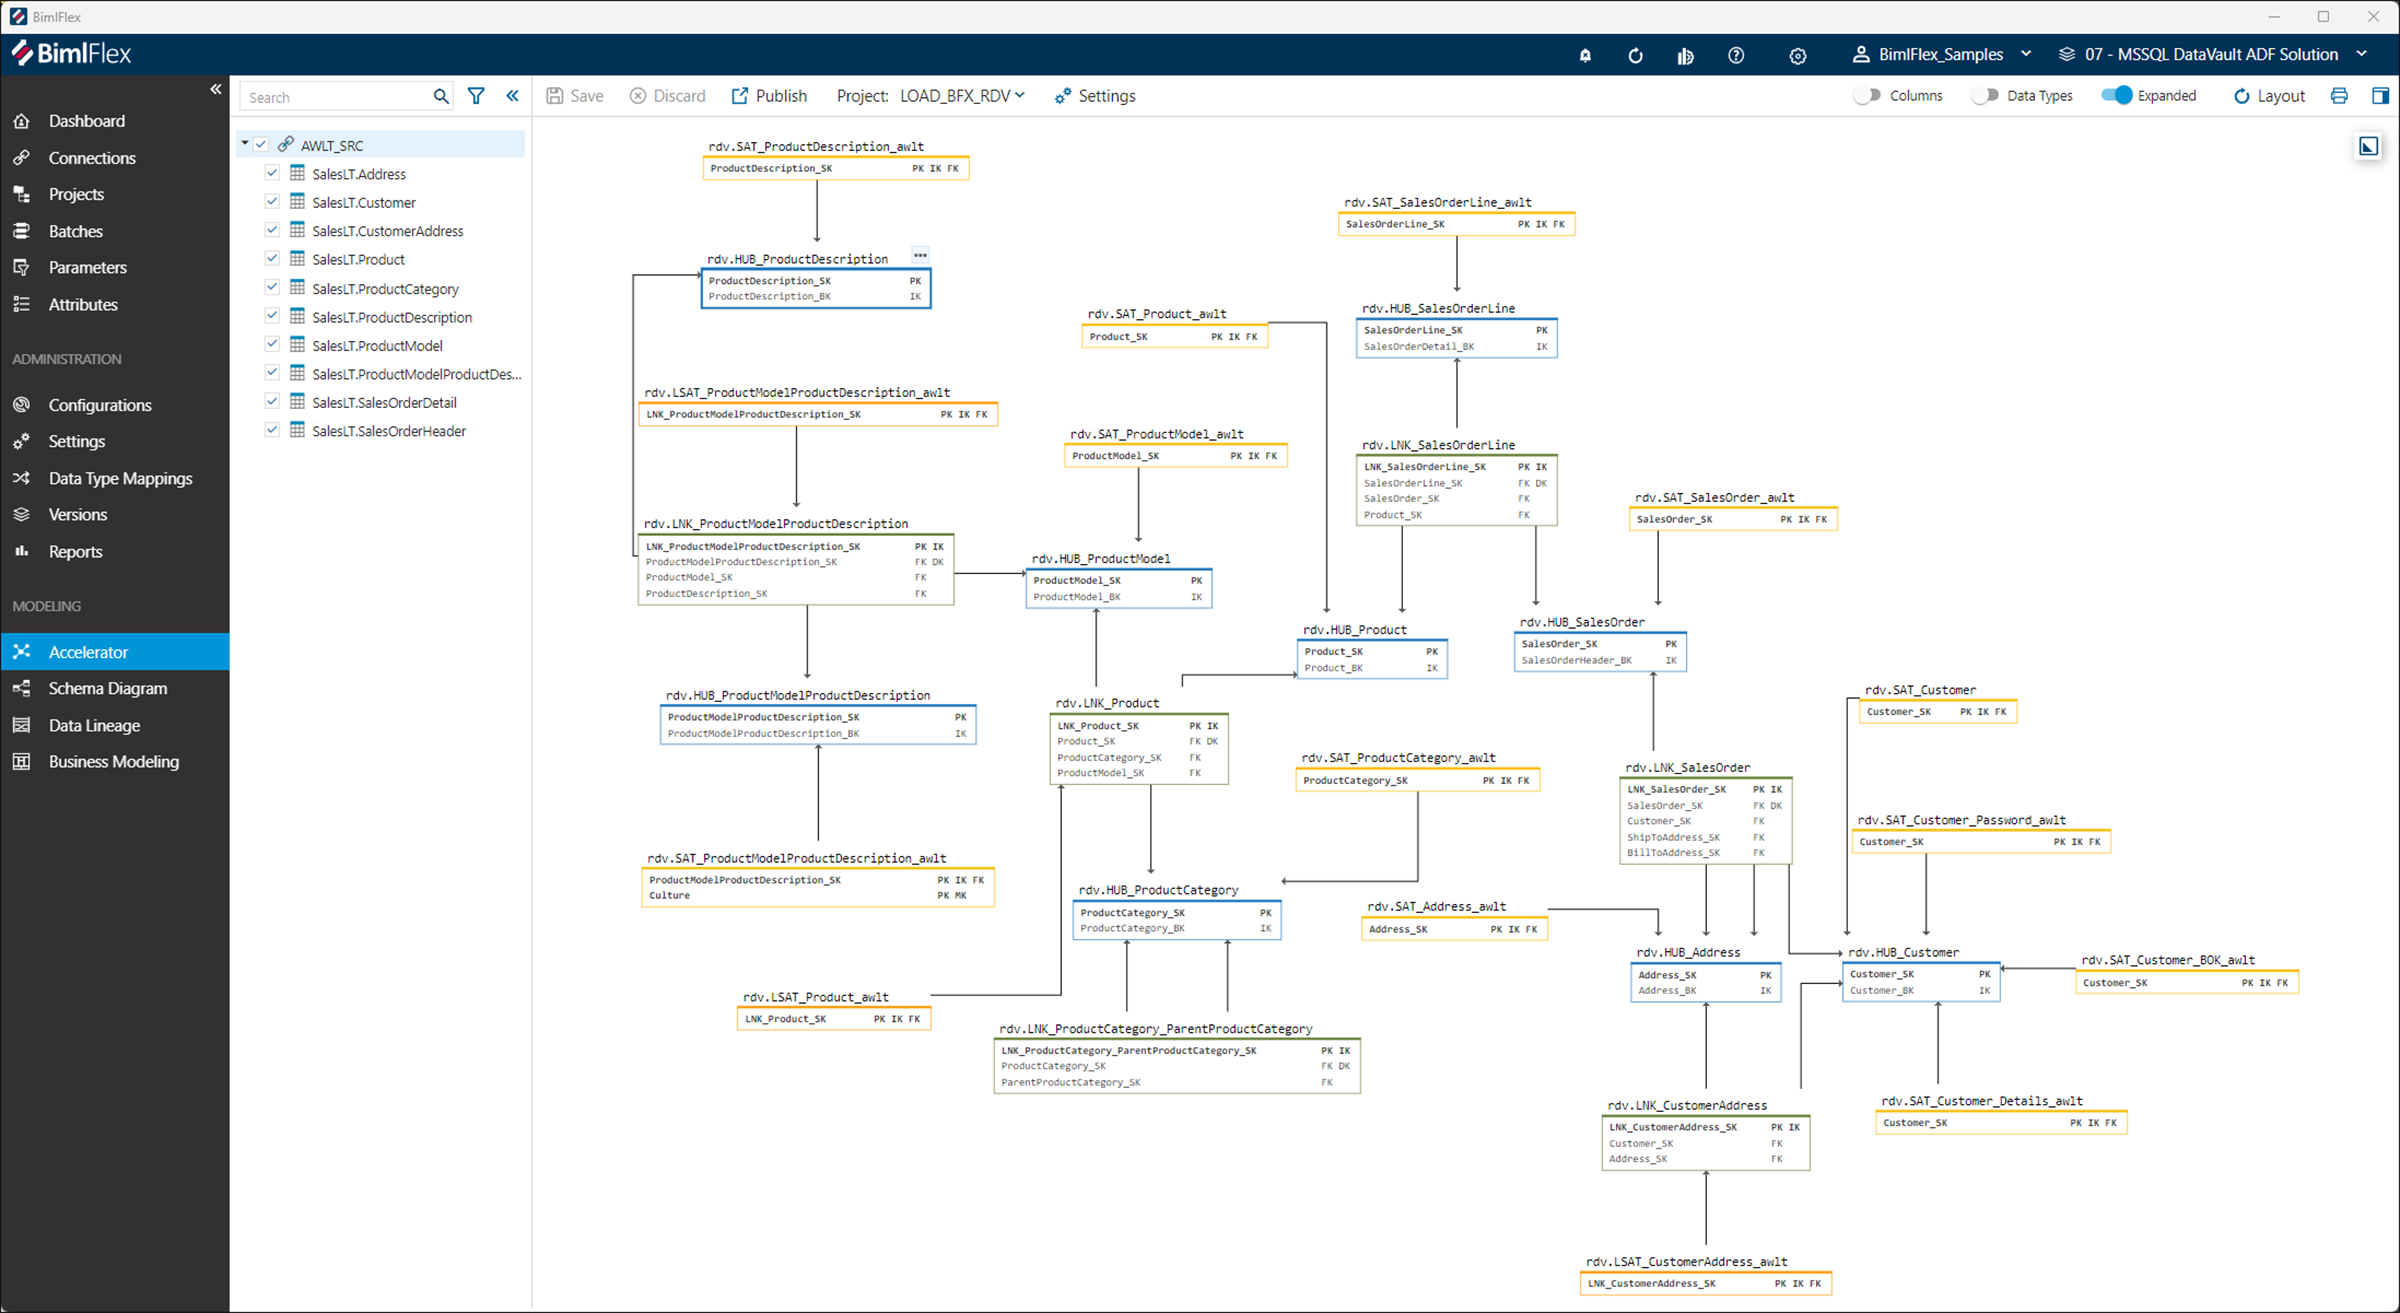
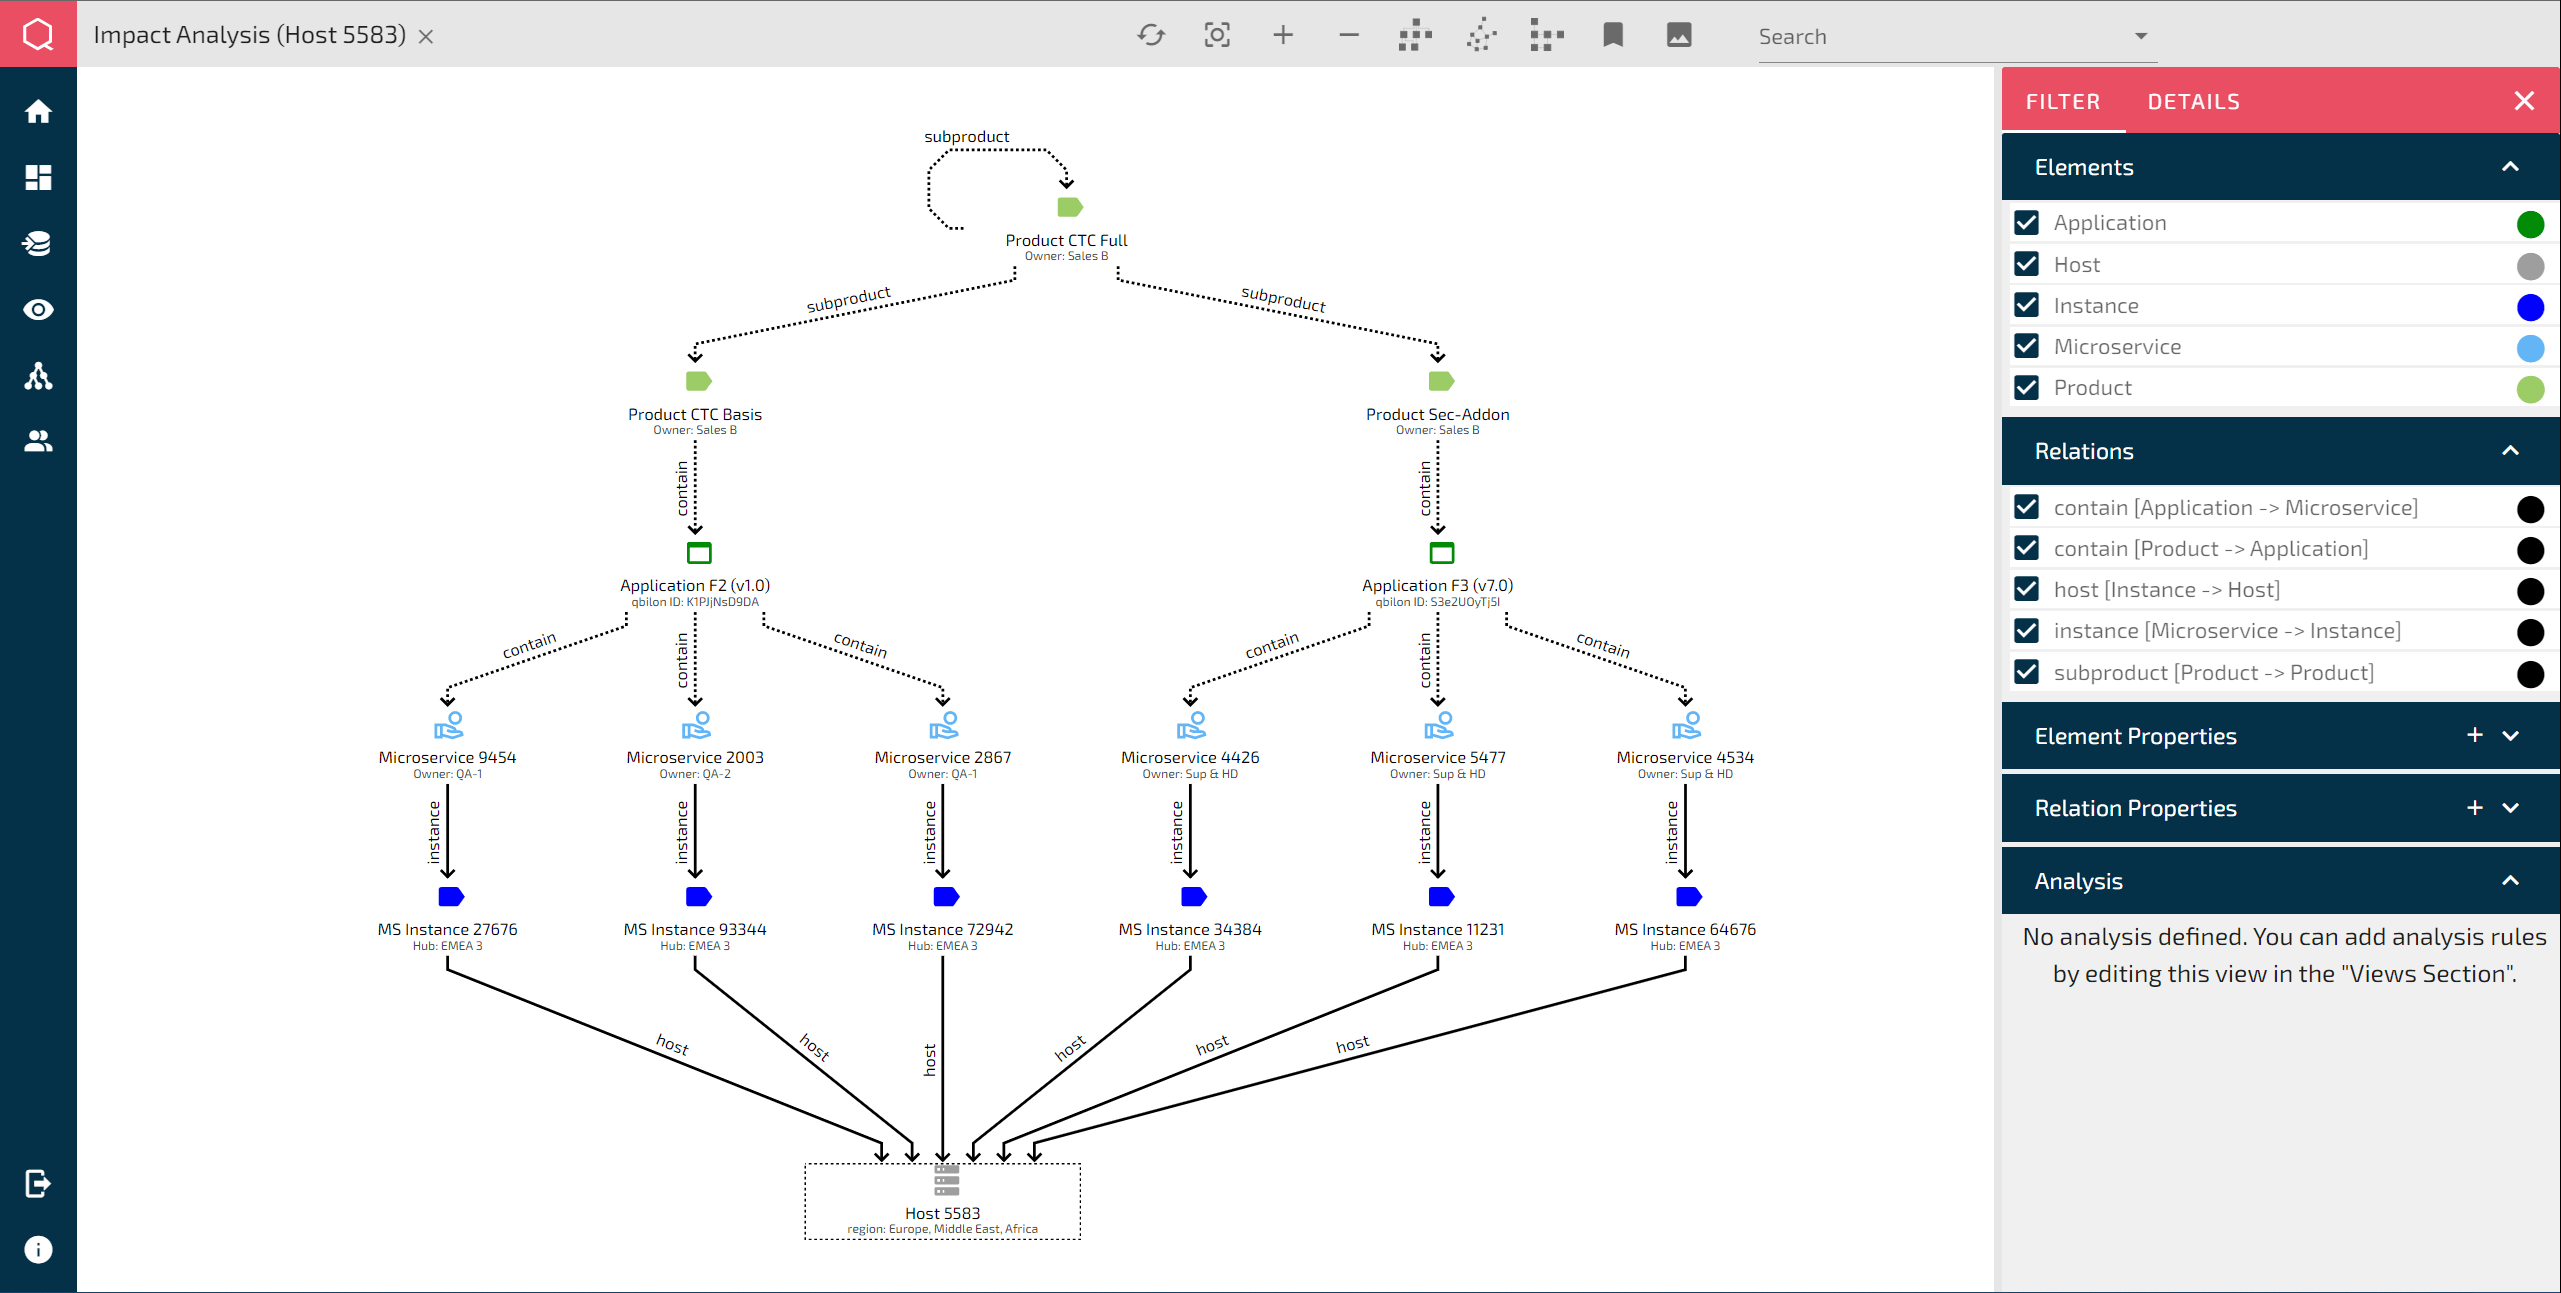
yFiles is a diagramming library available for JavaScript, Java, and .NET that helps you build interactive visualizations of connected data. Whether you're mapping organizational structures, supply chain networks, system dependencies, workflow processes, or social connections, yFiles provides the tools to turn complex relationships into clear, interactive diagrams.
The library includes automatic layout algorithms that arrange your graphs intelligently, interactive editing for building diagram editors, smooth animations, and graph analysis algorithms for finding patterns and paths in your data. Instead of building these features from scratch, you get a battle-tested API that integrates with modern frameworks and platforms.
yFiles handles the complex mathematics and interaction patterns so you can focus on your specific application needs.




Choose your next steps
Get connected
Connect with our Customer Success Team regarding your ideas or projects.

Download yFiles
Try yFiles free of charge.
