Diagramming for
Data ManagementUse diagrams to optimize the data lifecycle, map data strategy, and ensure data security and quality.
Efficient data management is the foundation of digital transformation. With yFiles, you can visualize, organize, and optimize every step of the data lifecycle—from collection and storage to analysis and governance.
Use powerful diagrams to map data strategies, ensure quality and compliance, and gain valuable insights for smarter business decisions.
Empower your team with interactive, customizable visualizations and take control of your company’s most important asset: data.


The role of visualization in effective data management
Every building needs a firm and reliable foundation. It may not be visible, but it’s absolutely essential. For a modern business keeping pace with digital transformation, this basis is data.
Stored on servers or devices, millions of bits and bytes encode personal and corporate details that can enable far-reaching insights and decisions. But there’s a catch: Unless this data is error-free and searchable, it’s almost useless. Data collection, storage, and documentation must also comply with legal requirements, and databases need to be compatible with company software.
Data management includes a wide array of measures to ensure data quality, consistency, accountability, and security – throughout the data lifecycle. Its goal is to make data usable for optimum support of your company, while upholding security standards and complying with privacy regulations. Data management also lays the groundwork for successful Business Process Management.
In modern business, flexibility and individualization of data requirements are a key to success. To optimally support existing data structures,
systems, and their interactions, a strong visual representation is often needed. Visualization helps staff fully understand the many ways data is used in the company.
Because of the many, and changing,
relationships between data and business processes, implementing your own visualization solution is ideal.
But this requires considerable effort.
Luckily, there’s an excellent solution that makes this really easy: A mature, highly customizable software library of ready-to-use components.
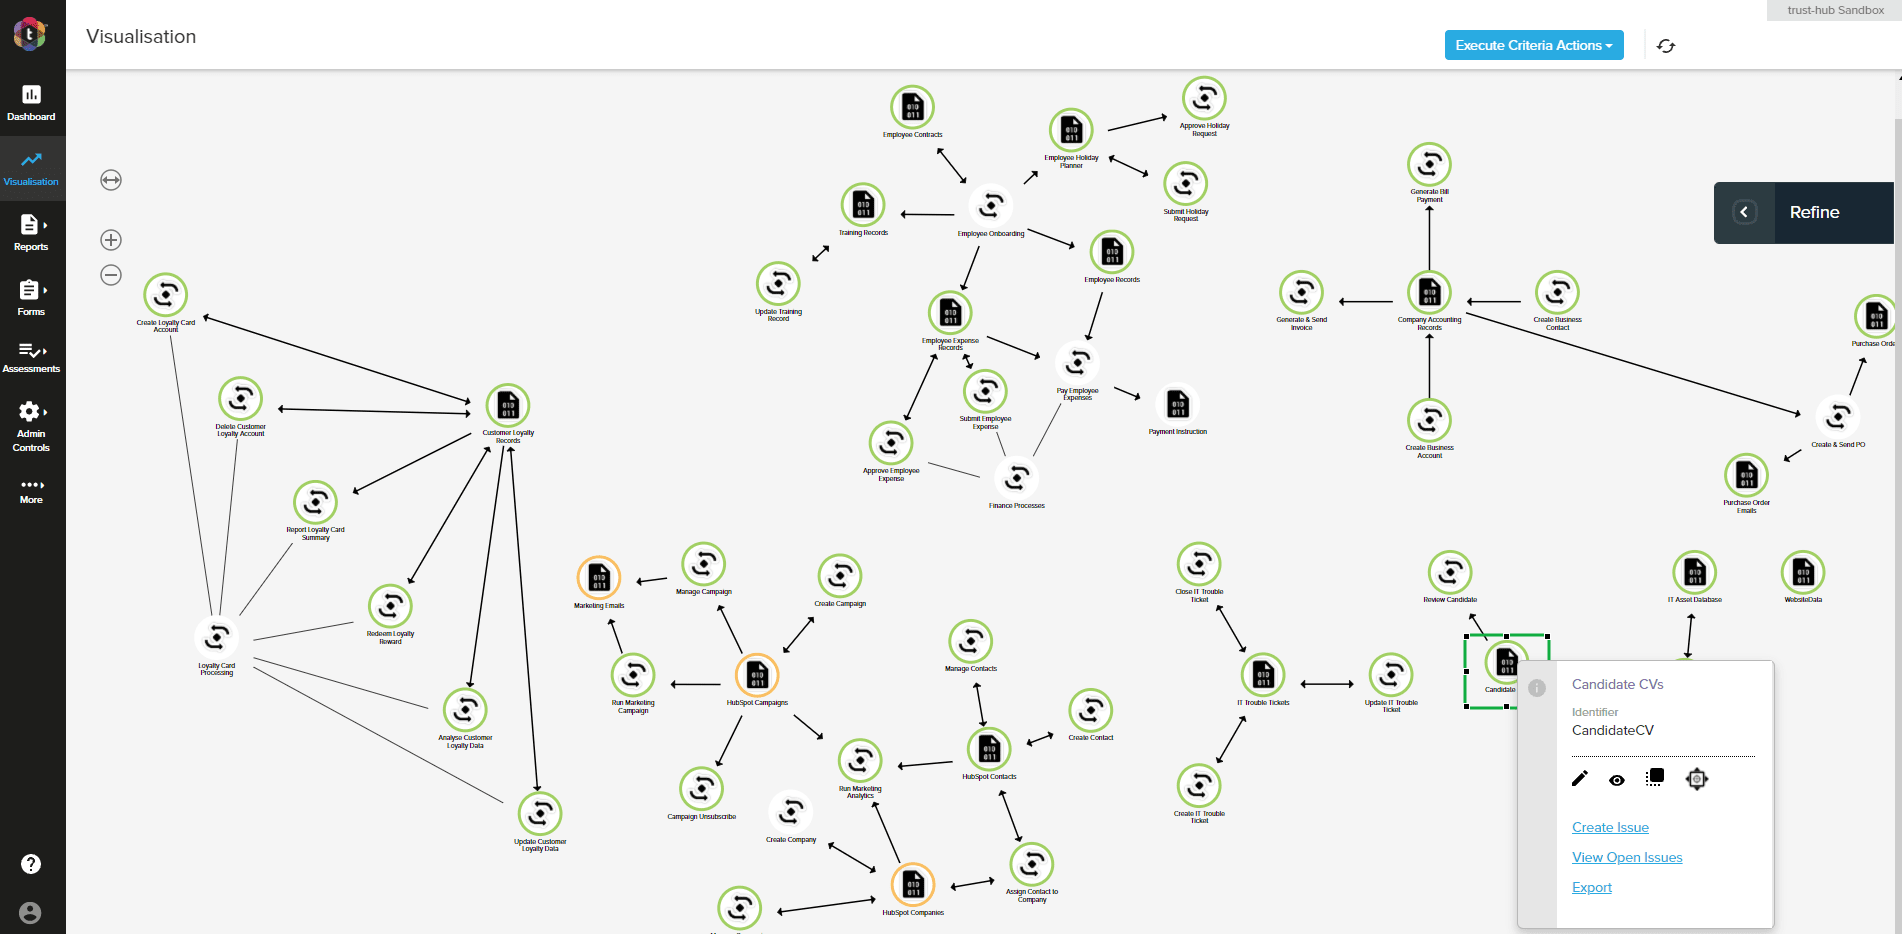
yFiles, our diagramming SDK, lets you visualize and edit all aspects of data management. Clear, interactive graphs quickly and easily display the path, processes, and transformations taken to produce a specific piece of information. Visual representations of data models and architecture help to organize your data and metadata. In addition, yFiles offers a wide range of automatic layouts and custom visualizations to prepare data for visual analytics and reporting.


Data analysis, and data-driven decision making, are sometimes also seen as part of data management. Naturally, visualization plays an indispensable role here showing capacity limits, outliers, bottlenecks, clusters, and much more. However, diagramming and graphing can lend support at every stage of the data lifecycle.
Online demos for data analysis

We´d love to help you. Reach out and we'll get in touch with you.
Your message has been sent.
About yFiles: The graph visualization SDK
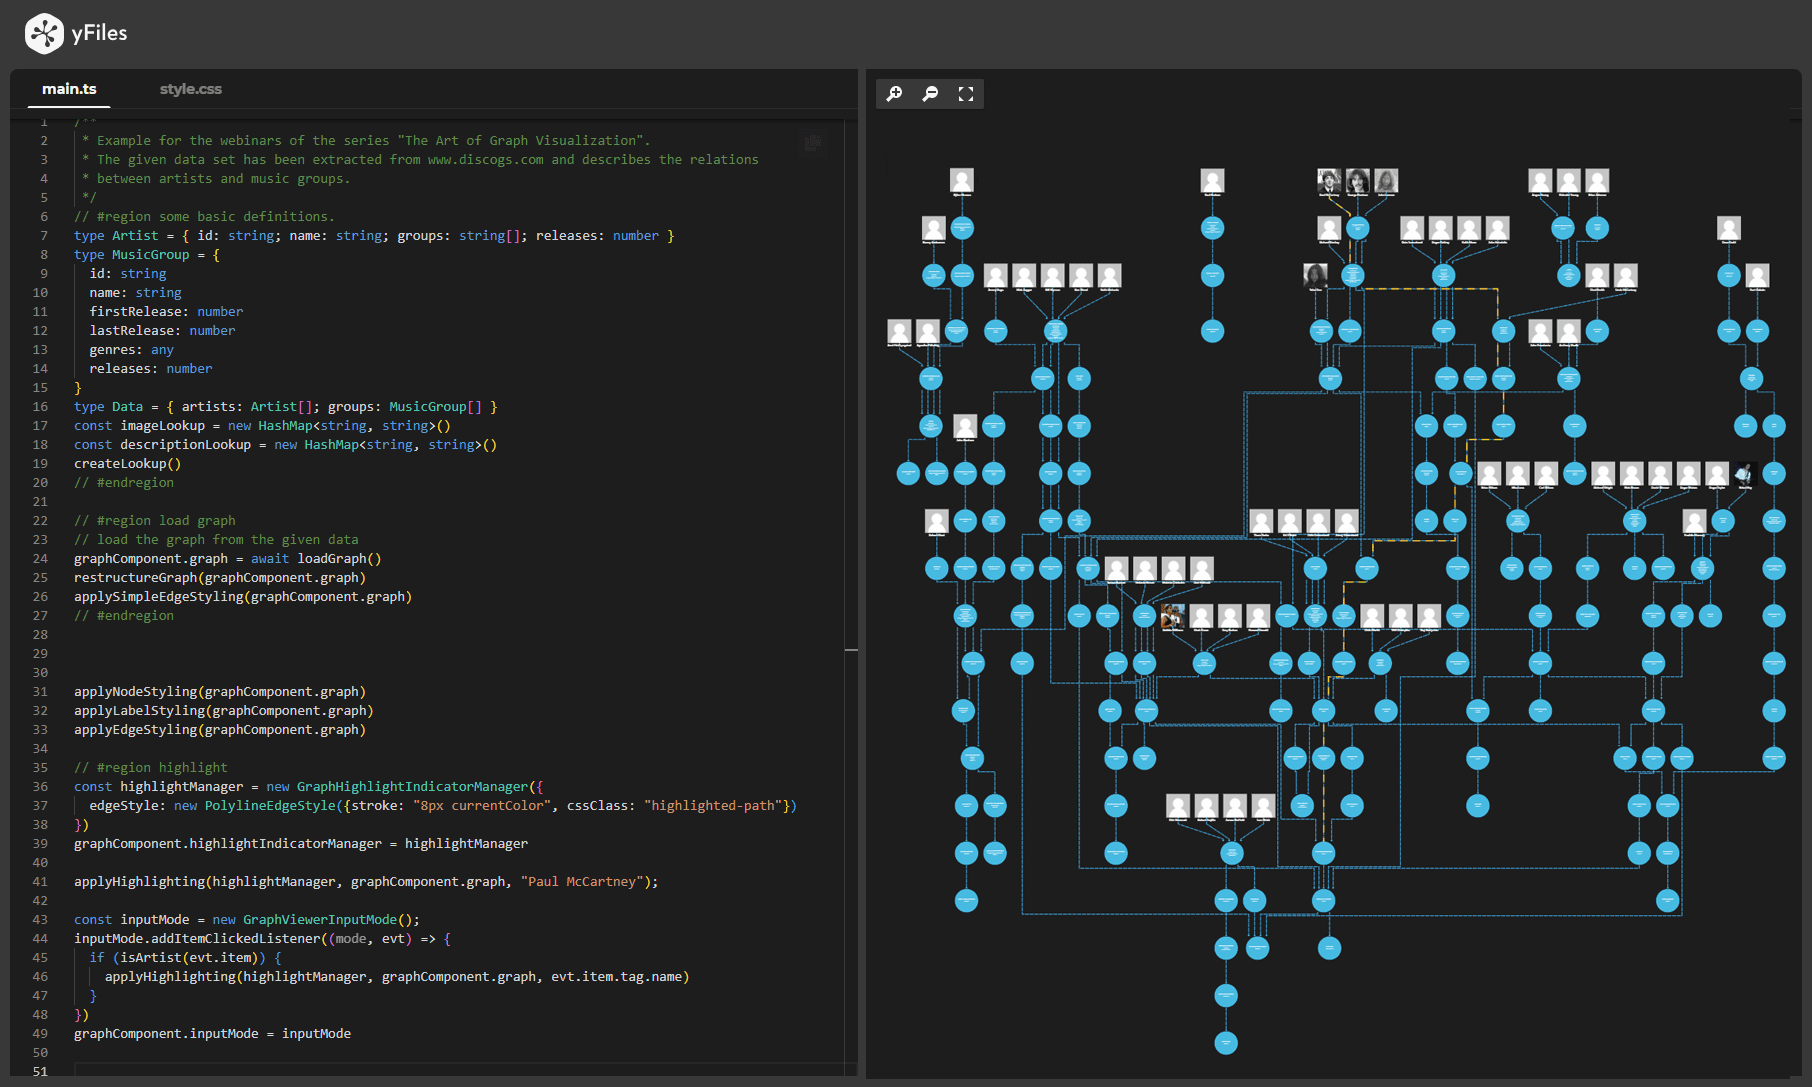
yFiles is your go-to SDK for crafting advanced graph visualizations, whether you're working with Web, Java, or .NET technologies. Its unmatched flexibility and scalability enable you to convert complex data into clear, actionable visuals, fitting for both enterprise and startup needs.
With yFiles, you're equipped for the future—supporting any data source while maintaining strong data security. Getting started is seamless, thanks to over 300 source-code demos, thorough documentation, and direct access to core developer support. These resources are available even during your free trial.
Backed by 25 years of graph drawing expertise, yFiles is trusted by top companies worldwide for their most critical visualization tasks.
Discover yFiles11 reasons why developers choose yFiles, the superior diagramming SDK
Key challenges of data management
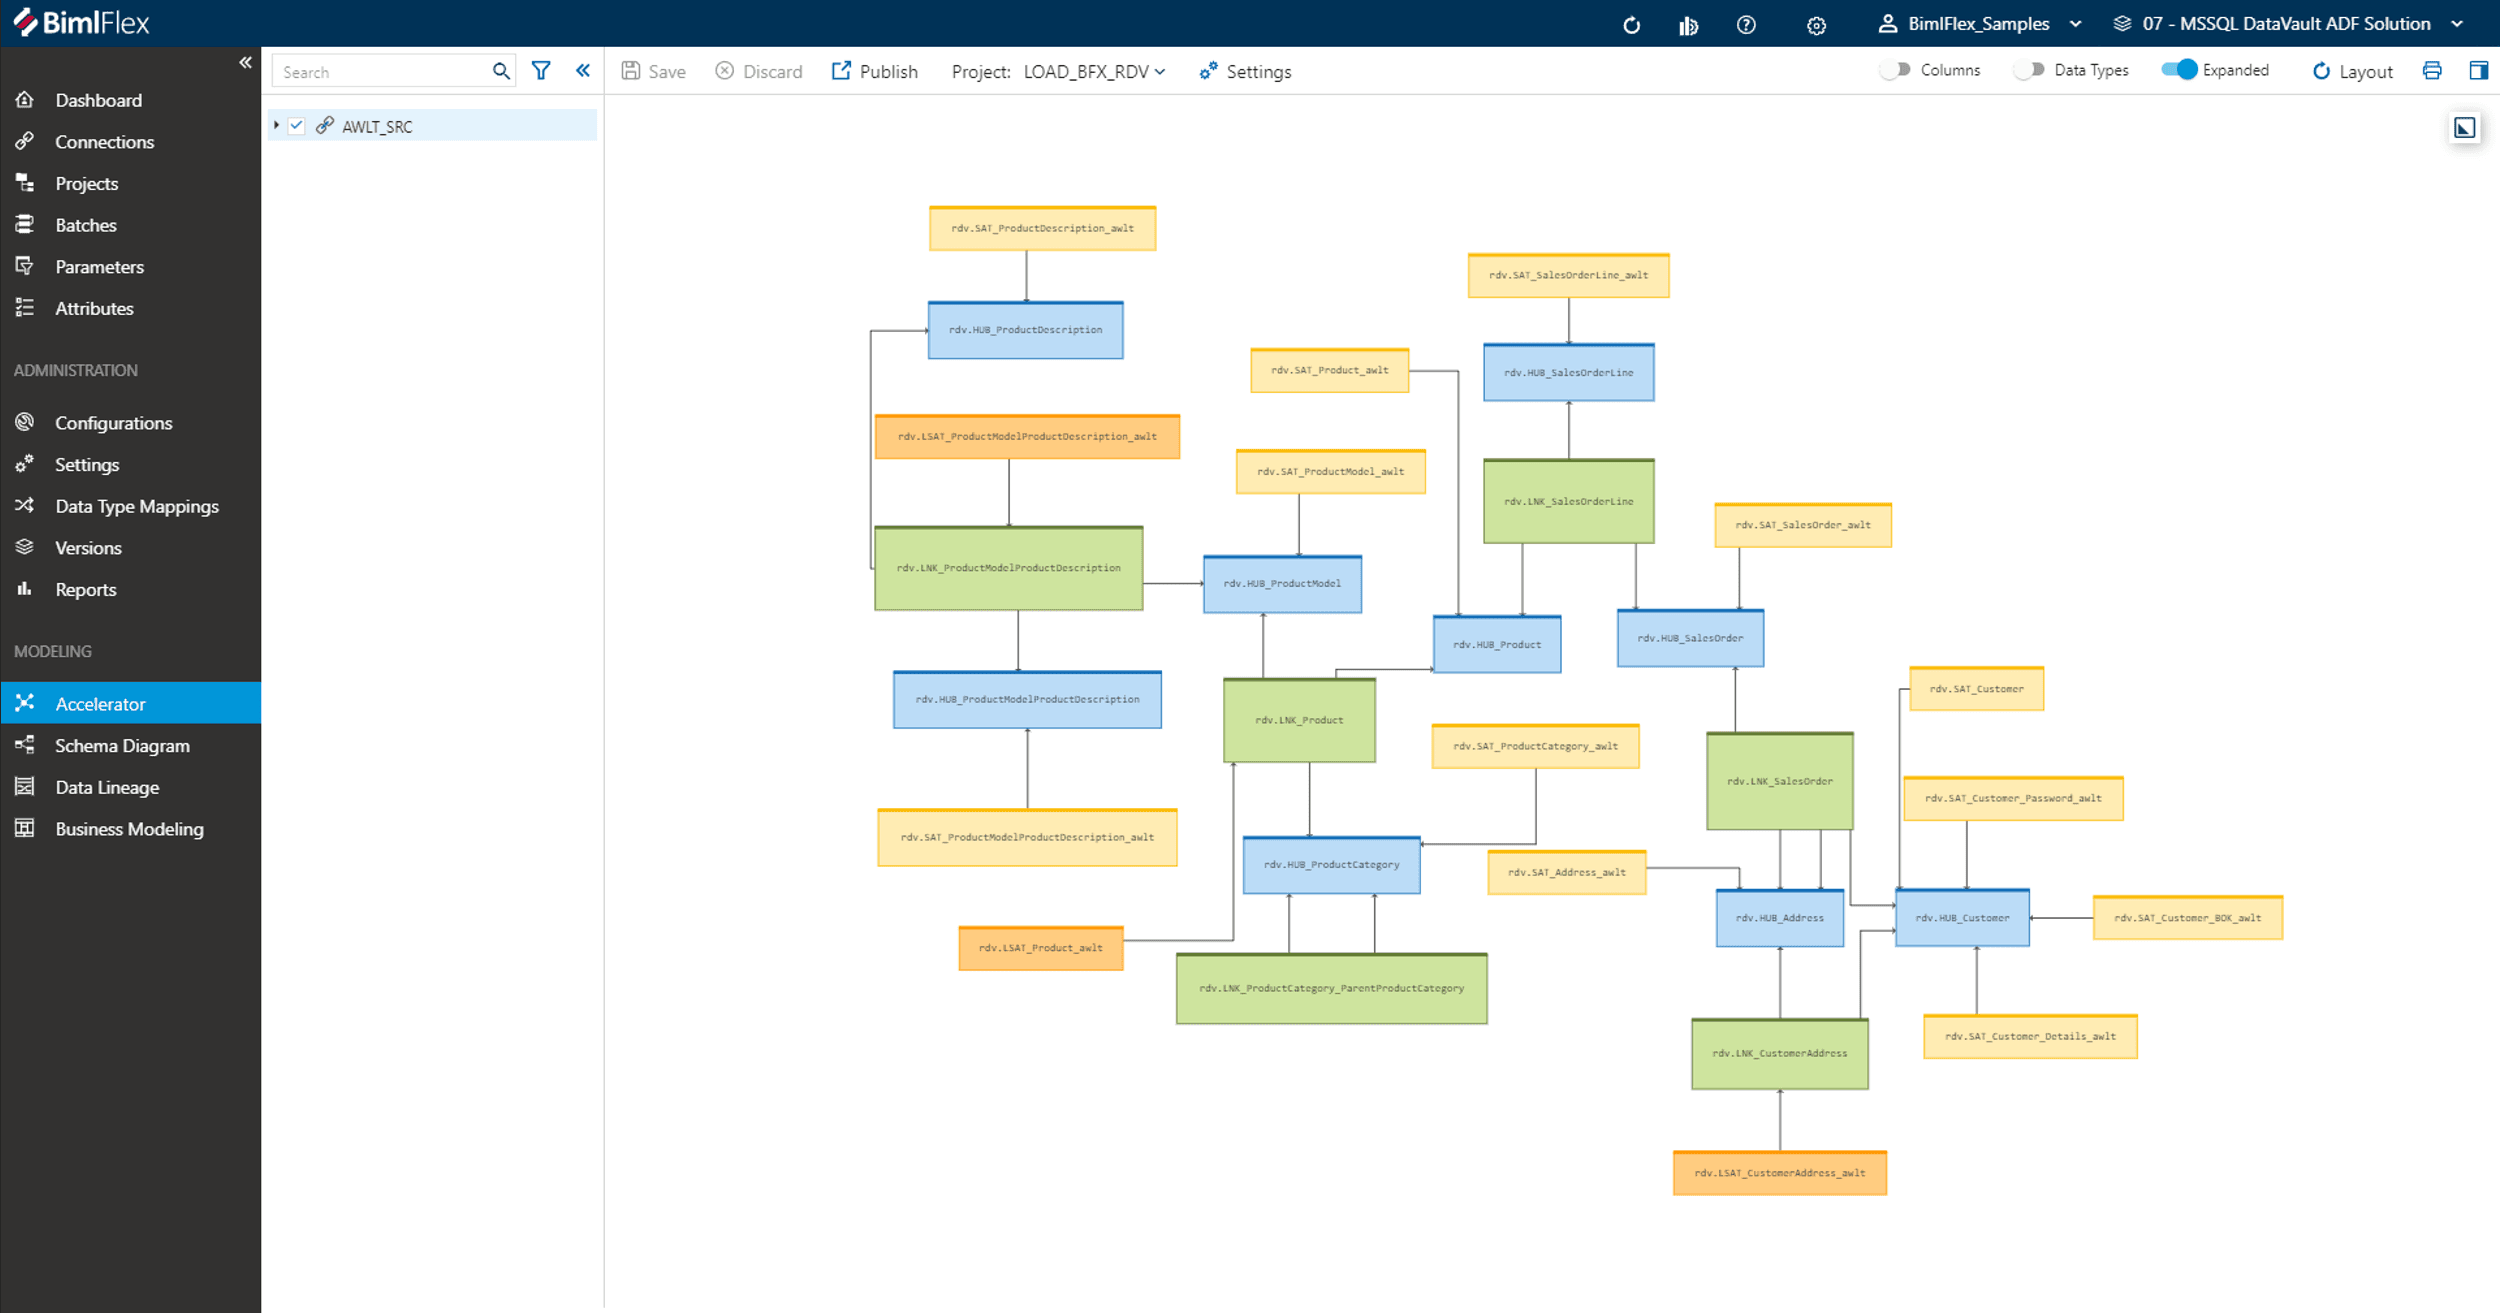
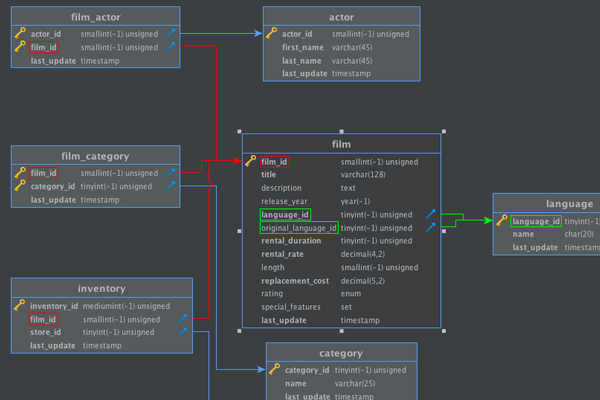
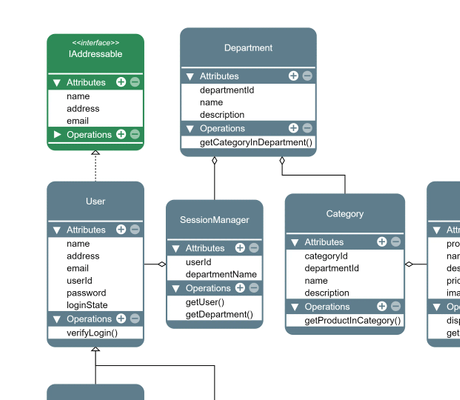
Customers use the diagramming SDK yFiles to support many different tasks: from planning and visualizing systems, process chains, and data architecture, to designing databases for efficient storage and compliant documentation. What’s more, data can be structured and prepared for quality management, using a very wide range of automatic layouts.

Data Warehousing (DWH)
Helpful links for DWH

Data Protection
Helpful links for data protection

Data Security
Helpful links for data security
When it comes to data security,
yFiles leads by example
Any tools used for data management must support data security.
That’s why yFiles focuses on data minimization, right from the start. yFiles sends no data to the outside. It even runs without an internet connection, if desired.
Furthermore, yFiles uses no third-party software, so you don't have to worry about security vulnerabilities there. Everything from one source means you have a single point of contact for all your questions and needs.
Our acclaimed support handles all concerns quickly, competently, and in strict confidence.
yFiles itself, along with the whole yWorks company, is GDPR-compliant in all areas.

Big Data Management
Helpful links for big data management

Data Modeling
Helpful links for data modeling

Data Governance
sets and implements rules for the data used (and/or stored) within an organization. It determines the data lineage scope, based on regulations as well as corporate strategy, while also considering critical data elements and reporting attributes. This, in turn, supports Master Data Management (MDM). MDM ensures that all standards, guidelines, rules, and policies are followed, and that the data is available, usable, consistent, accurate, and secure.
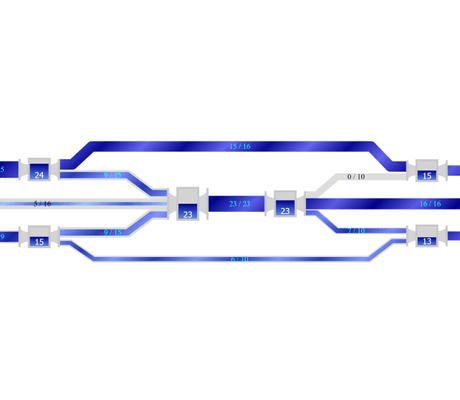
With yFiles, you get a clear visualization of your data model, which helps all stakeholders to understand which policies and standards apply to which data, and whether all the approvals are in place. BPMN diagrams let you easily trace processes and make responsibilities visible throughout the data lifecycle. Even highly complex data flows can be effortlessly planned: using automatic layouts to visually represent data lineage.


Data Lifecycle Management (DLM)
refers to the various stages that data goes through: from creation to storage, use, archiving, and finally disposal. DLM requires active management of the data throughout its lifecycle, so that the status of the data is clear at any given moment. This, in turn, enables a robust data protection infrastructure, compliant with data governance – and makes useful, clean and accurate data available to all authorized users at any time.
yFiles lets you plan, map, and document the entire data lifecycle. Where does information come from, how is it stored, how is it used, and when and why does it need to be deleted? For every stage, you can visualize which regulations and policies have to be observed, and how this affects the data. In addition, you can show data ownership and record all data access events. yFiles automatically structures the visualization with automatic layouts and ensures clarity, searchability, and easy data quality management.
There is so much more you can do with yFiles
Many approaches can be used to plan, monitor, and improve data management. Our diagramming SDK supports them all.
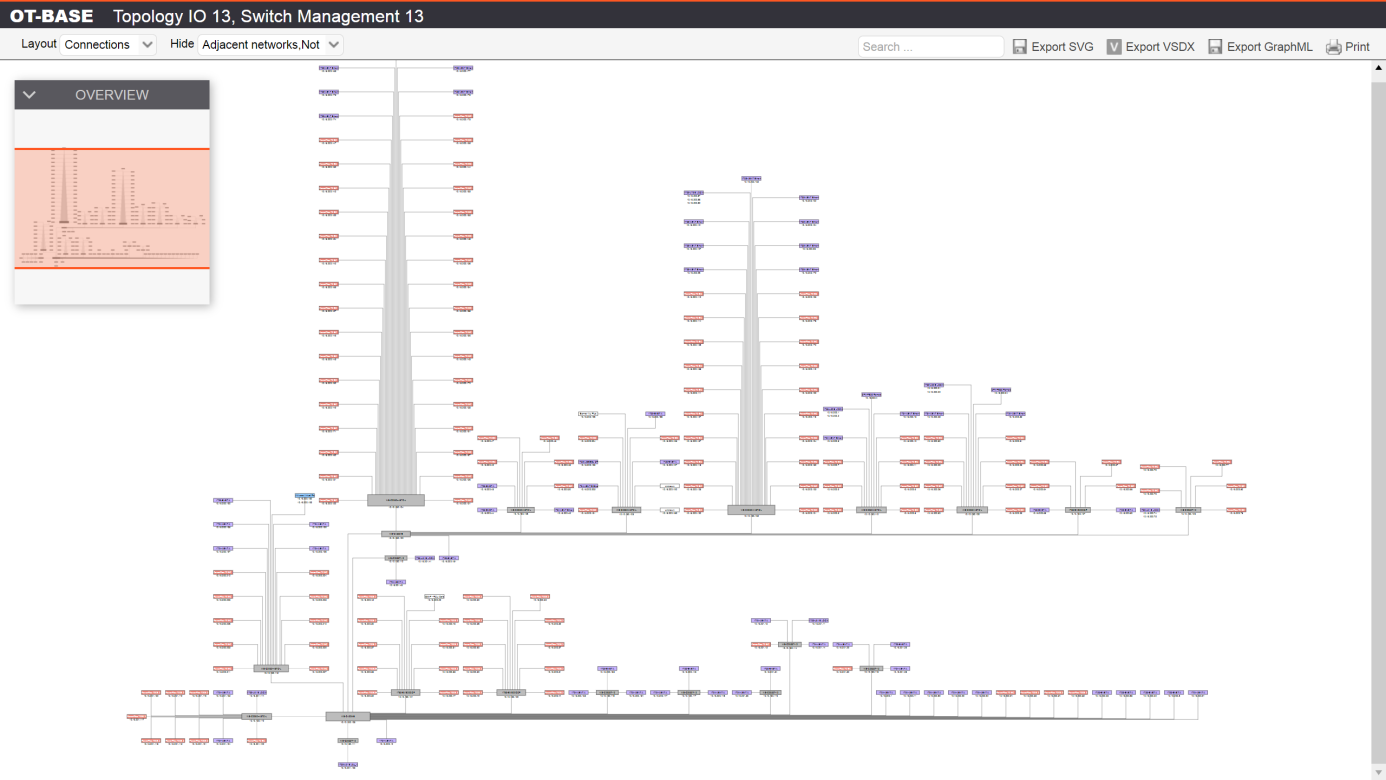
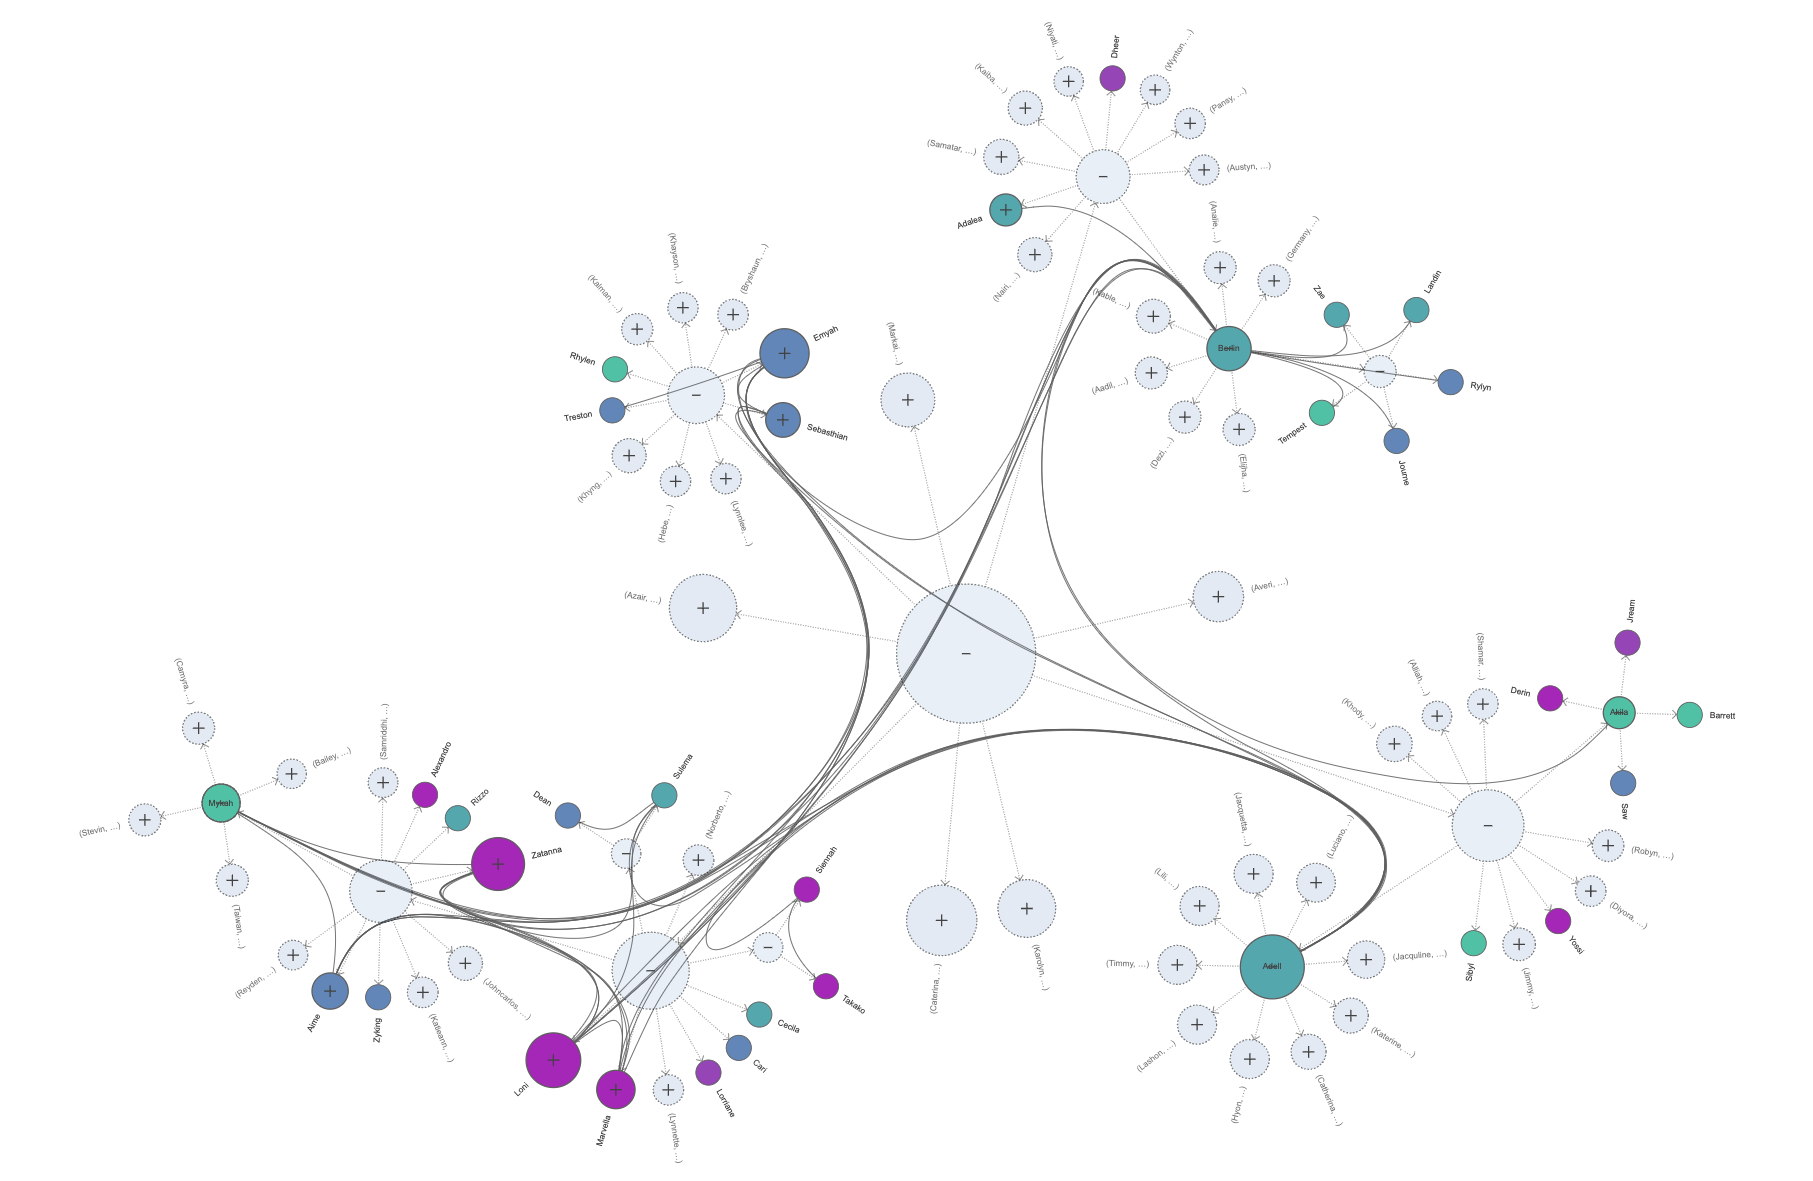
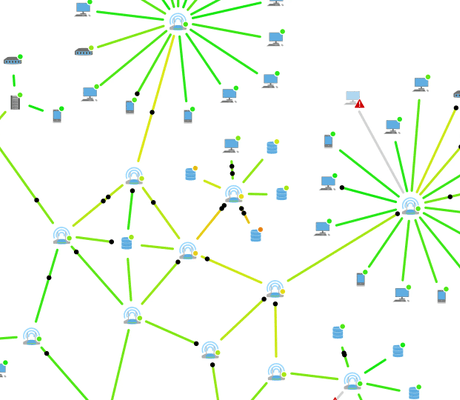
For example, yFiles lets you depict very large datasets and use visualizations like BPMN diagrams, flowcharts, network diagrams, and data flow diagrams to plan the movement of data within your company. This lets you monitor your network, pinpoint unauthorized access, and much more.
In the subsequent steps, yFiles also provides many options for analyzing data and generating insights.
Explore the interactive live demos that show the SDK’s strengths in data management. By the way, the source code of the demos is included in yFiles – even in the free trial!
And yFiles possesses a superpower: It adapts to any model, method, and scenario. Yes, even the ones we haven’t thought of yet.
Simply contact us, and we’ll discuss your use case and how yFiles can help.
Do you have a data visualization challenge?

Ask our Customer Success Team!
You will receive assistance from our Customer Success Team, whether you require technical support or have questions about our licenses or your evaluation.
Email: hello@yworks.com
Phone: +49 7071 9709050
Recap
Data management with yFiles
Data management is a critical discipline within modern organizations, encompassing the collection, organization, security, quality, and lifecycle of information to ensure it serves as a reliable foundation for strategic decision-making and compliance.
The yFiles SDK offers a powerful and flexible solution for visualizing and optimizing every aspect of data management by enabling teams to create clear, interactive diagrams for processes such as data warehousing, data protection and privacy, data security, big data processing, and data modeling.
With advanced features like automatic layouts, large graph aggregation, clustering, and customizable visuals, yFiles supports seamless integration with platforms such as Web, .NET, and Java while accommodating every data source and format. Its tailored visualizations make it easy to trace data lineage, enforce governance, map compliance, and streamline quality management.
For practical examples and implementation insights, readers can explore interactive demos and tutorials on big data visualization and database relationships.


