
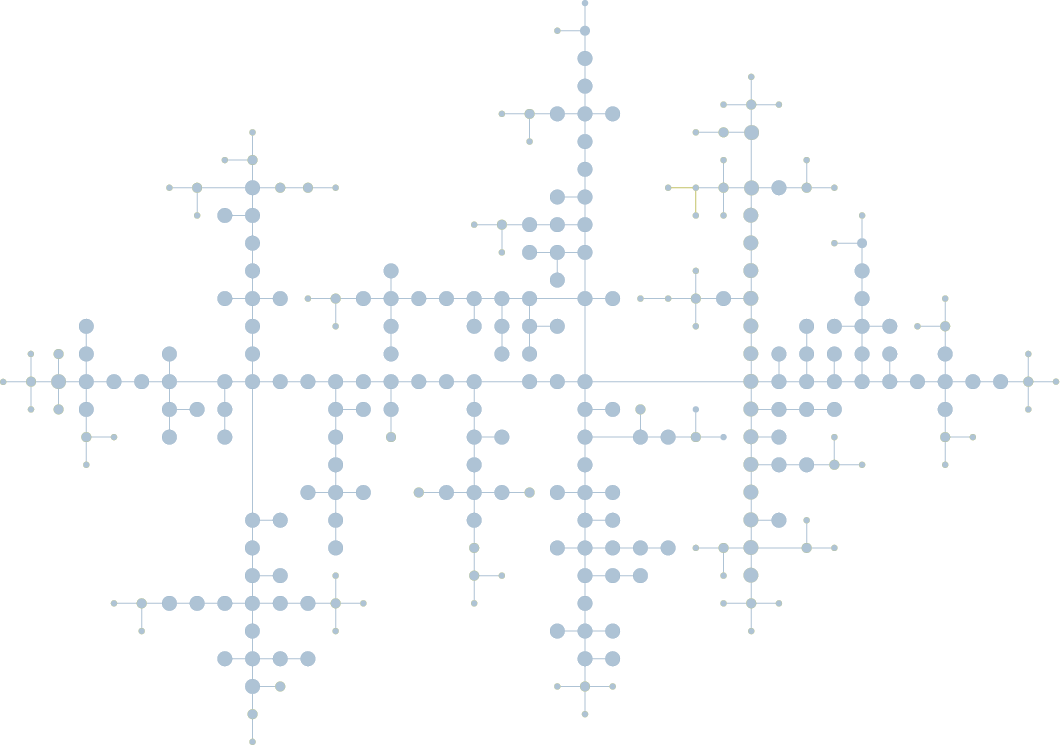
Unlimited Graph Visualization and Styling Capabilities—with yFilesyFiles features: Visualization and Graph Styling
yFiles provides rich visualizations for nodes, edges, labels, and ports along with options for styling selection and highlighting. If the desired visualization is not covered by the default ones, you can easily create completely custom visualizations.
Create interactive diagrams with yFiles, the network visualization library
The yFiles diagramming library supports you on any level, whether exploring its capabilities for the first time or developing a complete prototype. With hundreds of source-code demos available, getting started or diving into specific use cases is straightforward. Expert guidance from core developers ensures that challenges can be addressed efficiently.
Start visualizing complex networks and dynamic relationships today with yFiles!
Test yFiles free of charge

We´d love to help you. Reach out and we'll get in touch with you.
Your message has been sent.

Visualizations for different use cases
The yFiles library and accompanying demos provide visualizations for many different use cases out of the box, such as:
- Organizational Charts
- Business Process Modeling
- UML Class Diagrams
- Activity Diagrams
- Flowcharts
- Mindmaps
- Fraud Detection
- Computer Network Structures
- Social Networks
- Dependency Analysis
- Database Modeling
- Software Engineering
- Biochemical Pathways
- Biochemical Reaction Networks
- Use case Diagrams
- Semantic Networks
- File System Visualization
- Genealogies
Each implementation has its own set of attributes, allowing complete control over its appearance.

Rich built-in edge visualizations
yFiles provides several predefined edge visualizations that allow for further customization.
All edge styles support arrowheads on both ends, as well as strokes with settings for thickness, color, dashing and linecaps.
Predefined styles support drawing edges as an arc or polyline.
In addition, each style has its own unique settings, like rounded corners or arc height.
View demoGraph animation
yFiles also provides animations to smoothly transition a graph from one state to another, such as when layouts are recalculated.
Data binding
Visualizations can be tied to custom business data attached to graph items. For example, a node style for an employee in an organization chart can easily display the employee's name, position and other details directly from the associated data.

Customizable visual cues for selection, focus, and highlight
yFiles provides visual cues that are displayed when graph items are selected, focused, or highlighted. They can be disabled individually, or changed e.g. to a different color or replaced by something completely custom if needed.
View demoLevel-of-detail visualization
Improve diagram comprehension by displaying only recognizable elements at specific zoom levels. Level-of-detail rendering hides unreadable or unnecessary visuals, making room for a clearer overall picture.
Easily wrap existing styles in a fully controllable level-of-detail rendering and drastically improve diagram comprehension (and performance), even for large data models.
View demo
Sophisticated label rendering
Easily add text labels to nodes and edges to display additional information. Various placement options, such as inside or outside a node or on an edge near the source or target, ensure labels stay correctly positioned, even when items are moved.
Labels are not limited to short text phrases, they can hold multi-line text and show icons.
yFiles offers extensive formatting options, e.g. font, line spacing, and decorations, word wrapping and alignment.

Untangle edge crossings with bridges
Crossing edges can make complex diagrams harder to read. Bridges clarify the paths taken by those edges.
yFiles provides multiple bridging styles and crossing policies that determine how lines should bridge or cross each other.
View demo
Custom visuals to add auxiliary information to graphs
The canvas isn't limited to nodes, edges, ports, and labels alone. You can add arbitrary visualizations either in the background or on top of other graph items. Adding custom backgrounds, brand logos, legends, rulers or even dynamic helpers like snap lines help make a yFiles-powered application stand out.
View demoZ-Order of diagram elements
The drawing of diagram elements relative to each other can easily be changed. For example, changing edges to appear above nodes instead of below can be arranged simply by changing their order.

Style implementation tutorials
These step-by-step tutorials guide you through the implementation of custom styles for nodes, edges, labels, and ports.
In addition to the primary visualization, each tutorial covers related topics like hit testing, performance optimization, animation, business data integration and edge bridging support.
View demoDiagram Features
All diagrams consist of nodes and edges, of course. yFiles adds a number of unique features that help working with them, especially when they're getting larger. Grouping and folding lets you collapse and expand parts of the diagram. Swimlanes visually group parts of a diagram into rows and columns. Filtering can temporarily hide elements that are not important in the current view. A variety of import and export features make it easy to get your data into and out of graphs.
Grouping and folding
yFiles supports grouping of nodes into other nodes. Edges can still connect freely to any of them, including connections between a group and its children or between children of different groups.
Collapsing a group node hides the child elements of that group, they will be restored when the group is expanded again.
Custom actions are possible when groups are collapsed or expanded, such as running an incremental layout algorithm, or fetching data to create child nodes in the expanded group node.
View demoFiltering
Increase readability of large and complex diagrams by hiding less important parts. This is a similar concept to folding above, but not tied to having explicit parent-child relationships between nodes.
Possible uses include exploring large diagrams without having to show the whole diagram at once, or incremental search and filtering capabilities to quickly focus on relevant elements.

Swimlanes and Tables
Diagram types like BPMN use swimlanes to visually associate activities to a role. yFiles supports swimlanes and general tabular structures in which diagram items can be placed. They are supported by automatic layouts as well.
View demo
Data Input and Output
Easily and quickly build diagrams from any structured data source like CSV, JSON, XML, databases, and others.
Loading and saving diagrams using the standard graph exchange format GraphML is natively supported, including the information for styles, grouping, folding, and all the other yFiles features.
View demoImage Export
yFiles enables you to export diagrams to popular image and graphic formats, as well as print them. Note that not all formats are supported by every variant of yFiles.

Bitmap Images
Export diagrams to common bitmap image formats such as PNG, JPEG, BMP, and GIF.
View demo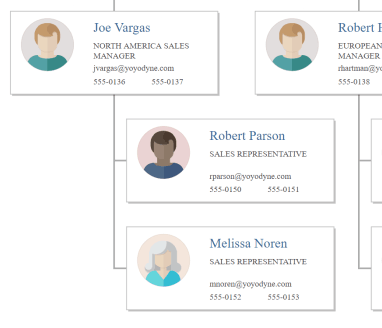
PDF and Vector Graphics
Create vector graphics such as PDF, SVG, EMF, and XPS from yFiles diagrams.
View PDF export demoView svg export demo
VSDX
Export graphs to the VSDX format with the VSDX Export for yFiles for HTML add-on. VSDX is a file format for diagrams used by Microsoft Visio®.
View demograph.nodeDefaults.size = [70, 70];
graph.nodeDefaults.style = new ShapeNodeStyle({
shape: ShapeNodeShape.ELLIPSE,
cssClass: "node",
});
graph.nodeDefaults.labels.style = new LabelStyle({
shape: LabelShape.PILL,
backgroundFill: "white",
backgroundStroke: "1px solid #6A8293",
font: "15px poppins",
textFill: "#6A8293",
});
graph.edgeDefaults.labels.style = new LabelStyle({
shape: LabelShape.PILL,
backgroundFill: "#6A8293",
backgroundStroke: "1px solid white",
font: "15px poppins",
textFill: "white",
});
graphComponent.fitGraphBounds()There is even more than just the visualizationCheck out what else can be done with yFiles
yFiles also offers versatile interaction possibilities. Set up a complete diagram editor for creating and editing graphs, with just a single line of code. Of course, everything about the interaction can be extensively customized to your requirements, and if the built-in gestures don't suffice, it's easy to add custom interactions.
yFiles features efficient and highly customizable algorithms for automatic layouts. A variety of layout styles are included: Hierarchic, organic (force-directed), tree, orthogonal, circular, radial and series-parallel. Almost all aspects of each layout algorithm can be customized to fit a specific domain and use case.
yFiles allows you not only to create, edit, display, and arrange graphs. There are also a number of analysis algorithms to determine common structural traits (such as connectivity, cycles, whether a graph is a tree and much more), pathfinding and reachability, clustering and centrality measures, graph traversals and many others.
Start building your first
interactive diagramming application!
Download yFiles for free!Choose your next steps
Get connected
Connect with our Customer Success Team regarding your ideas or projects.

Download yFiles
Try yFiles free of charge.
