
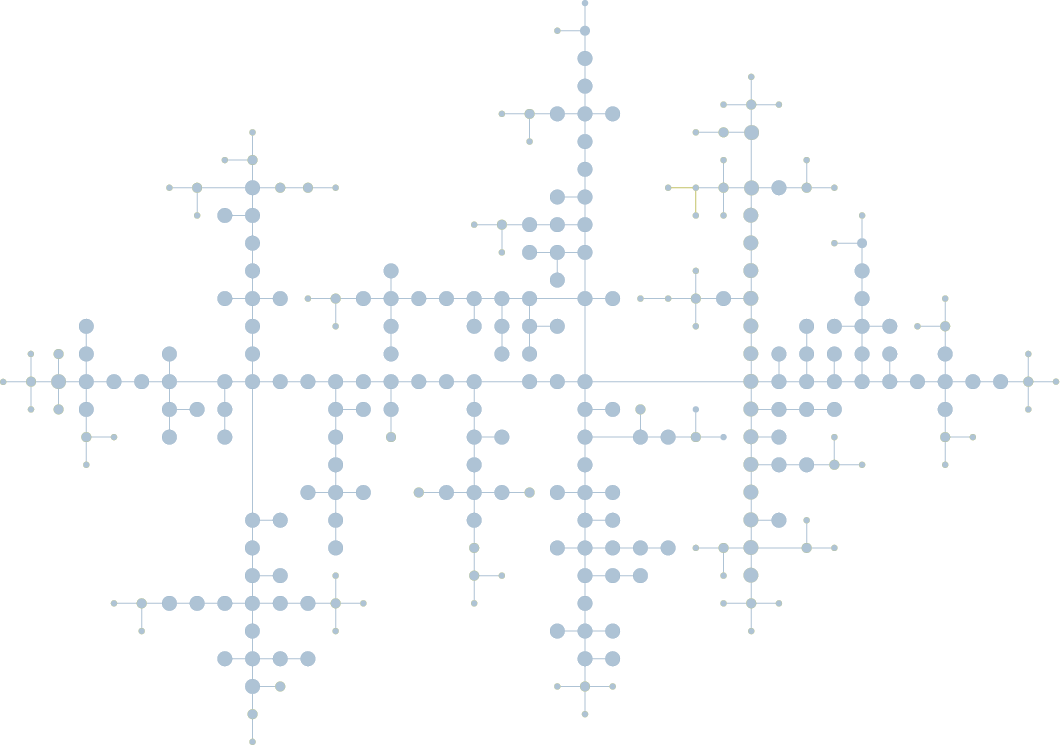
Coding: Hierarchical LayoutRunning example: team hierarchy
On this page, we use a login flow example to demonstrate how yFiles' hierarchical layout efficiently organizes the steps in an account login process. This process typically includes user input (username/password), validation, authentication, user actions, and the end result (success or failure).
This example is based on the webinar Hierarchical layout with yFiles on YouTube.
How to develop a hierarchical layout with yFiles

We´d love to help you. Reach out and we'll get in touch with you.
Your message has been sent.
Practical coding implementation
The practical examples within this content center around the Step-by-Step Guide. This section details a hands-on approach to building and refining a hierarchical layout using a common scenario: an account login process. It walks through the core customization stages, starting with the basic setup of the layout and then delving into custom layering, where nodes are strategically placed on different levels to reflect the flow of the login steps.
The guide further explores custom sequencing, demonstrating how to order nodes within the same layer to ensure a logical progression (e.g., "Sign Up" before "Login"). Finally, it covers edge routing, specifically showcasing how to use orthogonal routing and preferred label placement to create clean and understandable connections between the process steps.
These practical examples provide concrete illustrations of how to apply the theoretical concepts of hierarchical layouts in yFiles to achieve clear and structured visualizations of real-world processes.
Each of these steps will be implemented with specific examples and code to achieve a clean and organized account login process flow.
Running example: login flow
To demonstrate the principles of the hierarchic layout in yFiles, we’ll use a typical account login process as our running example. This flow will be modeled with a top-to-bottom layout direction, reflecting the natural progression of user actions.
We'll apply group constraints, such as ensuring that all child steps of the "Enter Account Data" node appear directly below it.
Additionally, we’ll customize edge routing so that connections enter and exit nodes from specific sides—for instance, from the west and east.
To improve readability, integrated edge labeling will be enabled, allowing labels to be placed during layout calculation with preferred positions, avoiding overlaps and ensuring consistent alignment.
This example will highlight how each customization contributes to a clearer and more structured diagram.
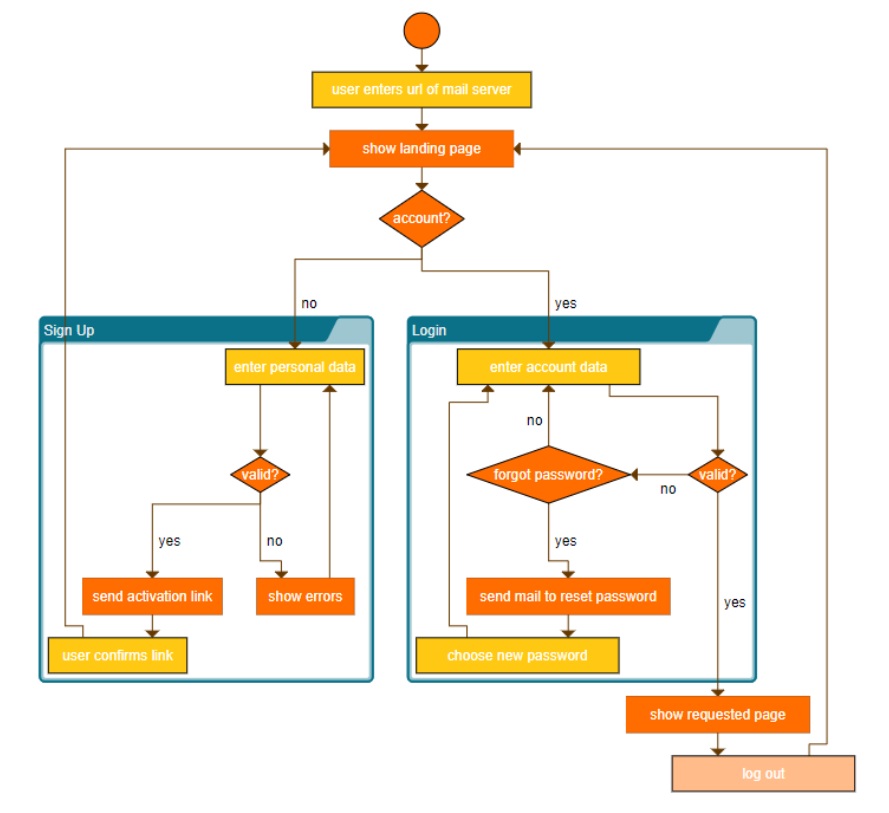
It typically involves the following:
- User Input: Enter username/password.
- Validation: Check if credentials are correct.
- Authentication: Verify user identity.
- User Actions: User proceeds if successful or retries.
- End: Process ends upon success or failure
Hierarchical layout:
- Nodes represent each step (input, validation, authentication).
- Edges connect transitions between steps (success, failure).
- It simplifies complex processes into a clear, visual tree structure.
Data Preparation
Prepare the node and edge data
Define your graph data as simple JavaScript objects: nodes, edges.
- Each node has a name (used as ID and label).
- Each edge references source (supervisor) and target (employee) by name.
Initialize the GraphComponent
Set up the rendering surface for the graph:
const graphComponent = new GraphComponent('graphComponent')
graphComponent.inputMode = new GraphEditorInputMode()
const graph = graphComponent.graph
Configure default styles (optional)
Define how nodes, labels, and edges should look:
graph.nodeDefaults.style = new ShapeNodeStyle({
  shape: 'round-rectangle',
  fill: '#8dc6ff',
  stroke: '1.5px solid #003f8a'
})
graph.nodeDefaults.size = [100, 40]

graph.nodeDefaults.labels.style = new DefaultLabelStyle({
  font: '12px sans-serif',
  textFill: 'black'
})

graph.edgeDefaults.style = new PolylineEdgeStyle({
  stroke: '2px #555',
  targetArrow: new Arrow({ type: 'triangle', fill: '#555' })
})
Create nodes and store references
Loop through the data.nodes array, create each node manually, add a label, and store the reference in a map (to resolve edges later).
This also places nodes in a basic grid before applying a layout.
Create edges by resolving node names
Use the map to find source and target nodes by name, and create the edges.
1. Basic Setup
First we start with a basic diagram where no layout has been applied so far!
Initialize a graph without any layout customization
graphComponent.fitGraphBounds()After that define the layout and layout data:
- Creating a
HierarchicalLayoutinstance. - Optionally creating
HierarchicalLayoutDatafor advanced configuration. - Applying the layout and its data to the graph.
graphComponent.fitGraphBounds()Even with this basic setup, yFiles intelligently arranges the graph, often producing a reasonable initial visualization. However, the true power lies in customization, which can be achieved through the LayoutData. Examples include:
Orthogonal edge routing
Configuring edges to be drawn with only horizontal and vertical segments for a cleaner, more technical look.
graphComponent.fitGraphBounds()Integrated edge labeling
Allowing the layout algorithm to automatically place edge labels optimally. Further customization enables precise label placement relative to the edge (e.g., to the left of the flow).
graphComponent.fitGraphBounds()Preferred label placement
You can fine-tune label positioning—for example, placing them on the left side of the edge, with a specific distance:
graphComponent.fitGraphBounds()This ensures that source-to-target labels consistently appear on the intended side—even when visually it may seem like the "right."
Layout orientation
graphComponent.fitGraphBounds()2. Custom Layer Assignment
Defining relative or absolute layer assignments for specific nodes, ensuring certain elements appear above or below others, or on the same layer. This addresses semantic ordering that the algorithm might not inherently understand.
Layer constraintsTo control vertical positioning, you can define relative or absolute layer constraints between nodes:
graphComponent.fitGraphBounds()This is useful when specific semantic ordering needs to be maintained that the automatic layout might not infer.
3. Custom Sequencing Within Layers
Controlling the horizontal order of nodes within a layer, ensuring logical placement based on the application's specific needs.
Sequencing constraintsTo control the horizontal order of nodes within the same layer:
graphComponent.fitGraphBounds()This ensures a logical left-to-right order aligned with your application's specific logic or domain.
yFiles also facilitates interactive scenarios where new nodes can be added to an existing graph, and the layout can be automatically adjusted to incorporate the new information without drastically altering the established structure.
4. Edge Routing Customization
graphComponent.fitGraphBounds()5. Incremental Layout
In dynamic applications, you can add new nodes and reapply the layout smoothly without disrupting the existing structure:
graphComponent.fitGraphBounds()With these configurations, yFiles gives you fine-grained control over both the structure and appearance of hierarchically laid-out diagrams—directly through code.
Start building your first
interactive diagramming application!
Download yFiles for free!Choose your next steps
Get connected
Connect with our Customer Success Team regarding your ideas or projects.

Download yFiles
Try yFiles free of charge.
